Research /Research
New York Is Growing Twice as Fast as New Jersey. That Changes the Border.
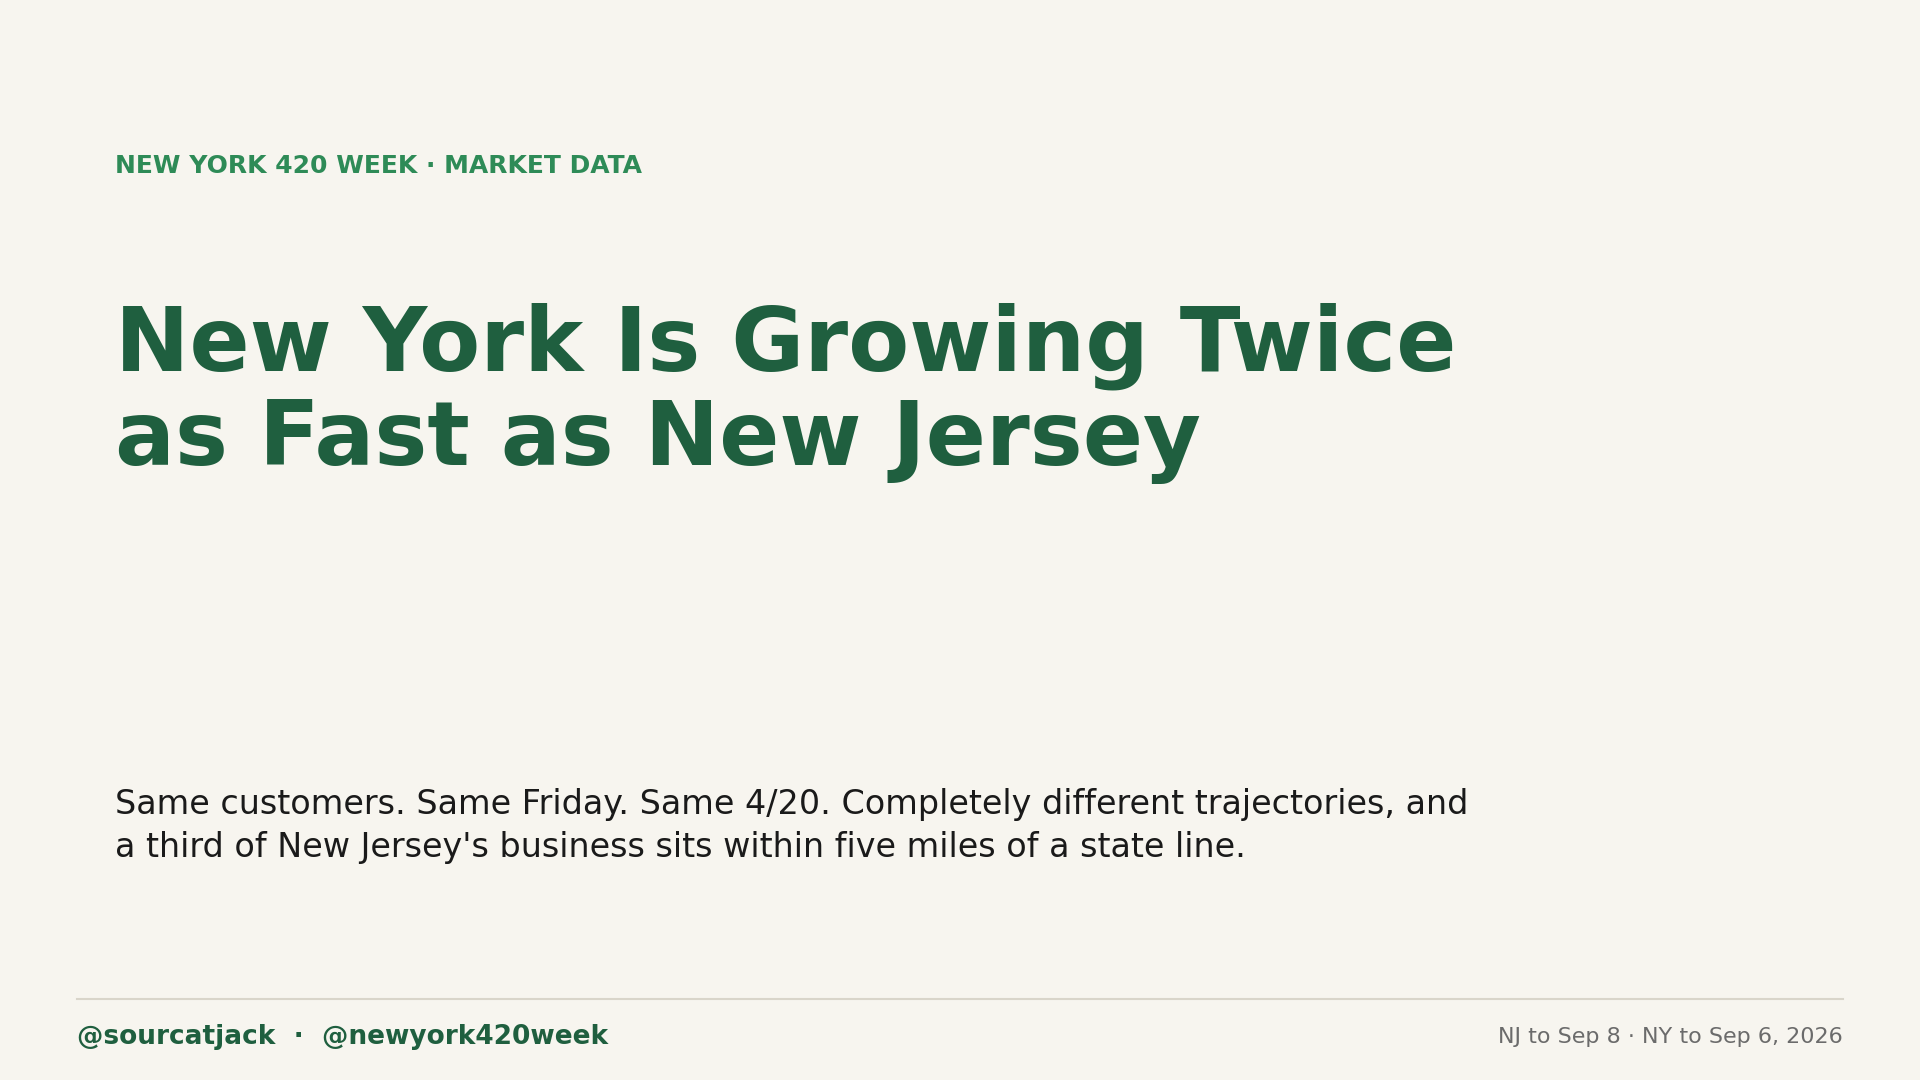
Same customers, same Friday, same 4/20. But New Jersey's daily run rate has been flat since July while New York's is still climbing — and a third of New Jersey's business sits within five miles of a state line.
Watch the story

Same customer, different market
Put the two markets side by side and the first thing that jumps out is how alike the shoppers are. New Jersey’s average item sold for $35.77 this year. New York’s went for $35.26 — fifty-one cents apart across sixty million items. Friday is 18.2 percent of the week in New Jersey and 18.4 percent in New York. April 20 ran 1.67 times a normal day in one state and 1.70 times in the other.
Two separate regulatory regimes, two separate supply chains, and the demand curve is effectively the same curve. Whatever is different between these markets, it is not the customer.
What is different is everything structural. New York has done an estimated $1.167 billion through September 6 across 630 dispensaries. New Jersey has done $966 million through September 8 across 310. New York is the bigger market in total and the smaller one per door: the average New Jersey store has sold $3.10 million this year against $1.85 million in New York, and the median Jersey shop, at $1.66 million, out-earns the average New York one.
The two markets, head to head
| Measure | New Jersey | New York |
|---|---|---|
| Estimated sales, YTD | $966.3M | $1,166.8M |
| Units | 27.0M | 33.1M |
| Average item | $35.77 | $35.26 |
| Dispensaries with sales | 310 | 630 |
| Sales per day | $3.85M | $4.69M |
| Median store | $1.66M | $1.21M |
| Average store | $3.10M | $1.85M |
| Friday share of sales | 18.2% | 18.4% |
| April 20 vs a normal day | 1.67× | 1.70× |
New Jersey Jan 1 – Sep 8, 2026; New York Jan 1 – Sep 6, 2026. Retail estimates, not point-of-sale reporting.
The gap that is closing
New Jersey opened for adult-use business about eight months before New York did, and for most of that head start the comparison flattered New Jersey. It is starting not to.
From January to August, New York’s daily sales rate rose 31.7 percent. New Jersey’s rose 16.9 percent. On units the spread is wider still — 40.8 percent against 23.6 percent. In absolute terms New York added $1.26 million to its daily run rate over those eight months; New Jersey added $590,000.
That head start is still visible in the per-store numbers and nowhere else. New Jersey licensed fewer operators and let them get big; a Jersey store that has been trading since 2022 has had three years to build a book of regulars in a town where the nearest competitor may be fifteen minutes away. New York licensed widely and fast, and the result is a state where the typical dispensary does $1.21 million a year and the tenth-largest store holds a smaller share of its market than New Jersey’s does of a market half the size.
Both states are growing the same way, and it is worth being precise about it: the growth is volume, not price. The average item got cheaper in New Jersey (down 5.5 percent, $36.95 to $34.92) and cheaper in New York (down 6.5 percent, $36.85 to $34.46). More people are buying more units and paying less for each one. That is what a maturing market looks like in both places. New York is simply doing it faster.
Growth, January to August
| Measure, January to August | New Jersey | New York |
|---|---|---|
| Sales per day | +16.9% | +31.7% |
| Units per day | +23.6% | +40.8% |
| Average item price | −5.5% | −6.5% |
| Daily rate added | +$0.59M | +$1.26M |
New York’s growth figures are day-of-week adjusted; New Jersey’s are plain monthly averages. The adjustment moves the New Jersey number by well under a point.
New Jersey stopped climbing in July
The monthly series is where this gets uncomfortable. New Jersey ran $3.51 million a day in January and climbed steadily to $4.14 million in July. Then August came in at $4.10 million and the first eight days of September at $4.13 million. Three months, no movement.
New York decelerated over the same stretch but never stopped: its month-over-month steps run +6.7, +3.4, +5.9, 0.0, +7.4, +3.0 and +2.0 percent. Slowing, yes. Flat, no.
The likeliest explanation is arithmetic rather than demand. New Jersey’s store count is close to fixed and its best locations are already built; growth has to come from existing doors selling more at falling prices. New York is still opening dispensaries, and a state that adds stores adds sales without needing any single store to improve. It is worth saying plainly that these extracts give one cumulative total per store, so same-store growth cannot be separated from new openings on either side.

Estimated sales per day, by month. New Jersey has added nothing since July; New York was still climbing into August. New Jersey is computed from the daily file; New York’s January and August rates are as published, with the months between derived from the published month-over-month steps.
Two different shapes of market
The concentration numbers say the rest. New Jersey’s ten biggest dispensaries take 21.9 percent of the state’s dollars; New York’s take 15.5 percent. Widen it and the gap widens with it — 100 stores account for 75.7 percent of New Jersey and 49.2 percent of New York.
New Jersey is a market with a head. New York is a market with a long, flat middle, which is what 630 licensed doors and a deliberately wide licensing regime produce. The brand shelves match: 774 brands recorded sales in New Jersey against roughly 1,150 in New York, and in neither state does any single brand hold more than about 4.4 percent.
New York is also not one market, which New Jersey mostly is. Regional brand mixes inside New York diverge hard: The Plug Pack does four times its expected share on Long Island and roughly a tenth of it in Manhattan. Manhattan over-indexes on low-dose edibles and hardware; Long Island buys value and volume. New Jersey, at a third the store count and a tenth the land area, does not split like that — its regional story is the Shore’s summer and Bergen County’s shortage of doors, not two different customers.
The difference is who those brands belong to. New Jersey’s leaderboard is house brands from vertically integrated multistate operators — Ozone from Ascend, Rythm from Green Thumb, Legend and Kind Tree from TerrAscend. The nine MSO retail groups run 29 of New Jersey’s 310 doors and take 30.3 percent of the money. New York’s top sellers, at least in Manhattan, are names like ayrloom, Ruby Farms, MFNY and Florist Farms. Same product category, opposite answer to who wins the shelf.
How concentrated each market is
| Concentration | New Jersey | New York |
|---|---|---|
| Top 10 stores | 21.9% | 15.5% |
| Top 100 stores | 75.7% | 49.2% |
| Brands recording sales | 774 | ~1,150 |
| Largest single brand | 4.4% | 4.2% |
Share of each state’s estimated retail dollars held by its largest stores and brands.
What this does to the border

New Jersey’s exposure here is specific and measurable. A third of everything the state sells — $331.5 million, 34.3 percent — comes from the 101 dispensaries within five miles of a state line. But the two borders are not the same business.
The 42 stores facing Pennsylvania average $4.60 million each. The 56 facing New York average $2.35 million — barely half. That gap is the whole argument in one number: Pennsylvania still has no adult-use market, so its residents drive east, while New York has 630 stores of its own and no reason to cross the Hudson.
The New York-facing side of New Jersey has already been discounted by New York’s existence. What a faster-growing New York does is deepen that discount — not by taking New Jersey’s customers, but by giving the remaining cross-river shoppers steadily less reason to bother. Convenience was the only argument left, and convenience erodes every time another dispensary opens in Rockland, Orange or Staten Island.
New Jersey's two borders are different businesses
| New Jersey border stores | Stores | Est. sales | Per store |
|---|---|---|---|
| Within 5 miles of Pennsylvania | 42 | $192.9M | $4.60M |
| Within 5 miles of New York | 56 | $131.7M | $2.35M |
| All within 5 miles of a state line | 101 | $331.5M | $3.28M |
Straight-line miles from each store to the legal state line, Census TIGER 2023 boundaries.
What to watch
Three things decide how this reads a year from now.
Whether New Jersey’s plateau is a ceiling or a pause. Three flat months is a signal, not a verdict, and the Shore’s seasonal unwind will muddy September and October. If the daily rate is still sitting near $4.1 million in December, that is a ceiling.
Whether New York keeps opening doors. Its growth has leaned on store count. The month-over-month steps are already decelerating; if licensing slows, the catch-up slows with it.
And Pennsylvania. Adult-use is still illegal there and a private-retail bill, SB 120, cleared a Senate committee in October 2025 without reaching a floor vote. That corridor is worth about a fifth of New Jersey’s sales. New York maturing costs New Jersey its weaker border. Pennsylvania legalizing would cost it the strong one.
Method
New Jersey figures are Lit Alerts retail estimates for January 1 to September 8, 2026, drawn from statewide daily, category, brand and store-level extracts, with regional cuts for Bergen County, North Jersey and the four-county Shore. The statewide file lists 312 dispensaries, of which 310 recorded sales.
New York figures are from the equivalent statewide extracts through September 6, 2026 — 630 dispensaries, 249 daily rows, 1,150 brands — reconciled across files to within five cents on a $1.167 billion total, with the partial final day excluded from every rate. The named New York brand comparison is Manhattan only, from a separate brand-level extract, and is not a statewide ranking.
The two states are reported on their own windows and are never summed. Border distances are straight-line miles from geocoded store addresses to the legal state line in the Census Bureau’s TIGER 2023 boundaries. All sales figures are menu-sampled estimates rather than point-of-sale reporting, so treat them as directional.
Words by Greg Silverstein · @newyork420week · @sourcatjack