Research /Research
Rain Costs Manhattan Six Points. It Costs Staten Island Nothing.
We matched every significant weather event of 2026 against daily sales in all five boroughs separately. The answer isn’t about weather at all — it’s about whether the customer is walking or driving. And the two storms that broke each borough were completely different storms.
Here is a good argument for never trusting a statewide average.
Run 2026's weather against New York State's cannabis sales and you reach a confident conclusion: rain is irrelevant. Every archived flash flood, severe thunderstorm and tornado in the metro area this year, averaged together, moves the state's daily sales by about a point. Noise.
Then pull the same analysis for the 283 licensed dispensaries inside the five boroughs — $487 million of sales, 40% of the state — and the conclusion inverts. In the city, rain costs about five points of a day, every time.
Then split the city into its five boroughs and the real answer appears: rain costs Manhattan six points and Staten Island under one — less than it costs Buffalo.
All of those numbers are correct. The state is big enough to bury the city inside it, and the city is big enough to bury two boroughs that behave nothing alike.
The test
We took the National Weather Service's own archive of significant weather events for the New York metro area in 2026 and laid each one against daily sales, adjusted for day of the week so a Friday storm is measured against Fridays.
Then we split New York seven ways: Manhattan (95 stores), Brooklyn (83), Queens (72), the Bronx (19), Staten Island (14), and everywhere else in the state — Long Island, Westchester, the Hudson Valley, the Capital Region, Syracuse, Rochester, Buffalo. New Jersey rides along as a seventh comparison.
If a storm is hitting Bushwick and not Buffalo, that design will show it.
Rain, by geography
| Event | NWS description | Five boroughs | Rest of NY | NJ |
|---|---|---|---|---|
| Wed May 20 | Severe storms, flash flooding, Brooklyn & Queens | +1.1% | +6.1% | +5.7% |
| Sat Jun 6 | Severe thunderstorms, damaging winds | −6.8% | +3.7% | −3.4% |
| Thu–Fri Jun 11–12 | Severe storms | −2.6% | +1.4% | +1.0% |
| Mon–Tue Jun 22–23 | Heavy rain, localized flash flooding | −5.3% | −2.8% | −2.2% |
| Sun–Mon Jul 5–6 | Heavy rain, localized flash flooding | −0.1% | +3.2% | +0.4% |
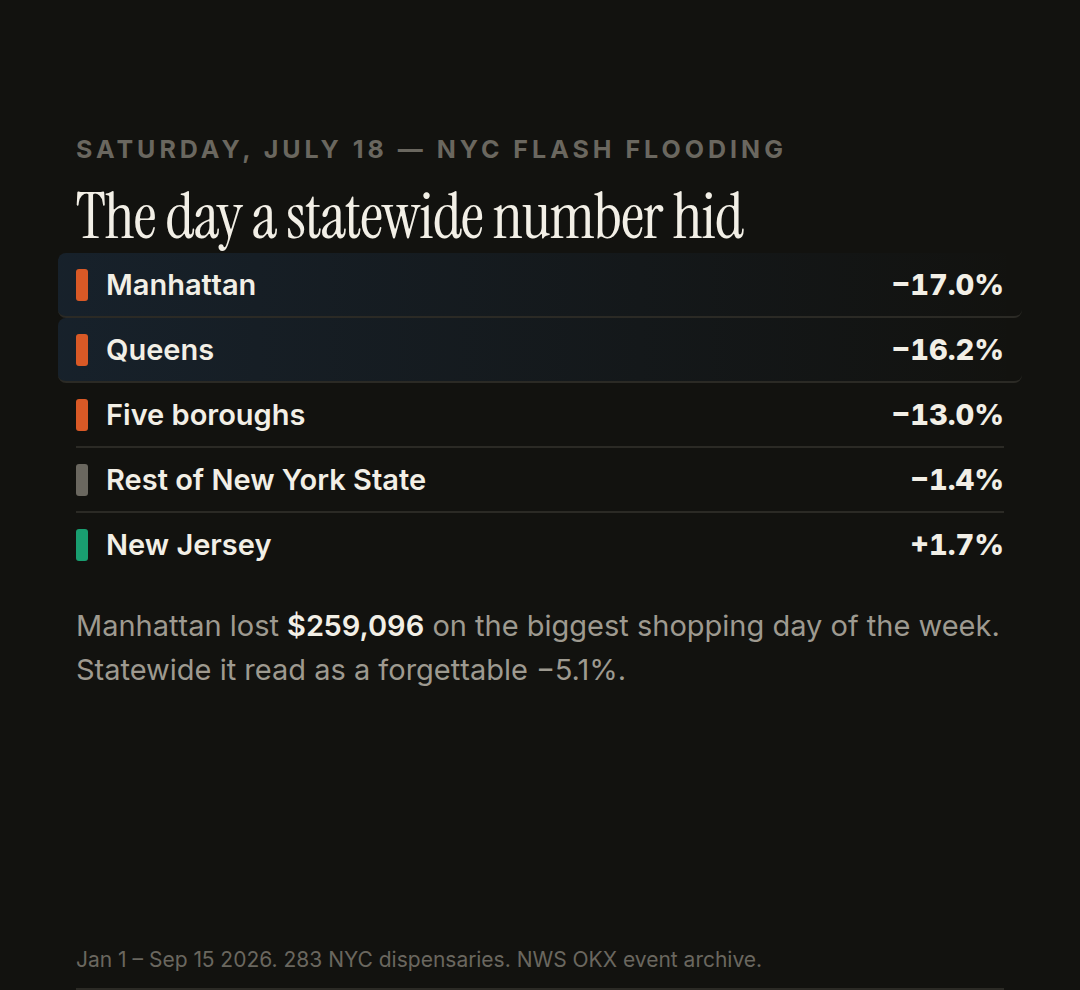
| Sat Jul 18 | NYC flash flooding (CNN) | −13.0% | −1.4% | +1.7% |
| Tue Jul 21 | EF-0 tornado, heavy rain | +1.8% | +7.4% | +3.6% |
| Thu–Fri Aug 20–21 | EF-1 tornado, heavy rain | +0.6% | +7.8% | +5.0% |
Read the last three columns across each row. On nearly every storm day of 2026, the five boroughs came in below the rest of the state — often while the rest of the state was having a perfectly good day.
Averaged across all of them, borough by borough — each measured against its own normal day:
| Rain & storm days | Normal day | Cost of rain | |
|---|---|---|---|
| Manhattan | −4.6% | +1.4% | −6.0 points |
| Queens | −1.0% | +4.3% | −5.3 points |
| Brooklyn | −0.2% | +3.6% | −3.8 points |
| Bronx | +1.2% | +4.6% | −3.4 points |
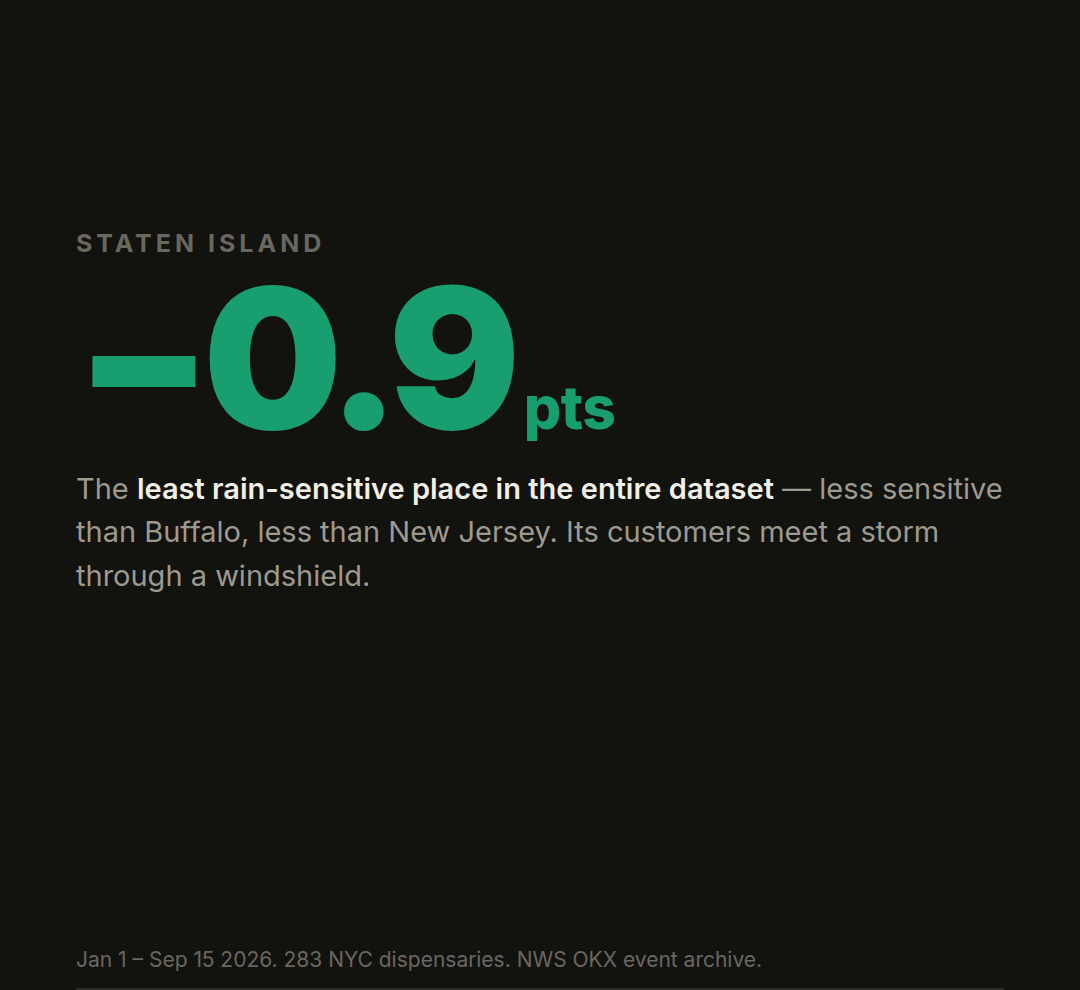
| Staten Island | +3.3% | +4.2% | −0.9 points |
| Rest of New York | +3.2% | +5.3% | −2.0 points |
| New Jersey | +1.8% | +4.0% | −2.1 points |
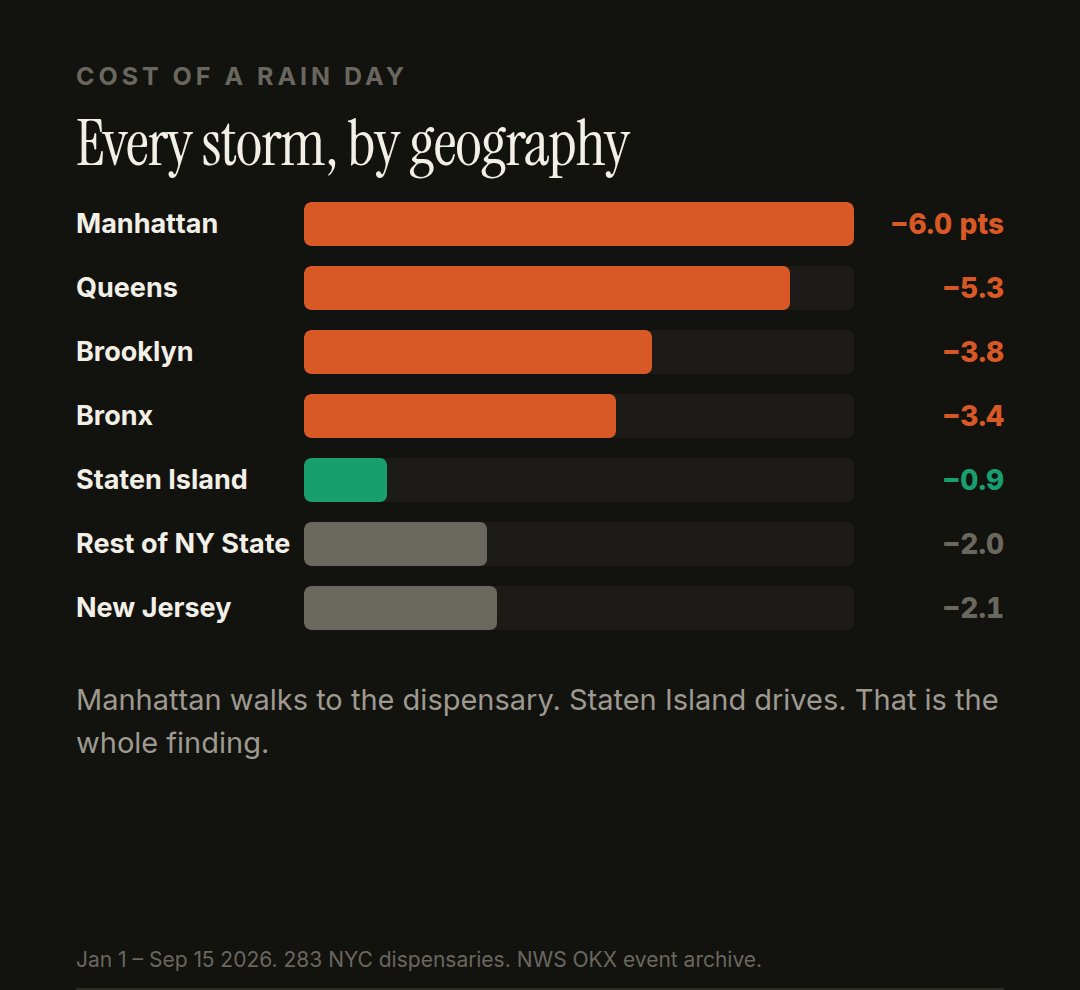
Manhattan is roughly three times more rain-sensitive than the rest of the state. And then there's the bottom of the list.
Staten Island proves the mechanism
Look again at that table. Staten Island — a New York City borough — is the least rain-sensitive place in the entire dataset. Less sensitive than Buffalo. Less than New Jersey. Rain costs it nine-tenths of one point, which is nothing.
That is not a quirk. It's the control group the analysis needed, and it arrived by accident.
Staten Island is the borough that drives. It has the city's highest rate of car ownership by a wide margin, no subway to Manhattan, and dispensaries on commercial strips with parking. Its customers experience a rainstorm the way a customer in Rochester does: through a windshield.
Manhattan is the borough that walks. Its customers experience a rainstorm on the sidewalk, or they don't go.
Same city, same weather, same legal market, same week — and a 5.1-point gap in how much a storm costs them. The variable isn't the city. It's whether the customer is in a car.
Two more events make the point, because a statewide number would show you neither:
| Manhattan | Brooklyn | Queens | Bronx | Staten Island | |
|---|---|---|---|---|---|
| Mon–Tue Jun 22–23 — flash flooding | −9.2% | −0.3% | −3.9% | +3.7% | −1.9% |
| Sat Jul 18 — NYC flash flooding | −17.0% | −10.3% | −16.2% | +0.3% | −11.7% |
June 22–23 was almost purely a Manhattan event. July 18 hit four boroughs hard and skipped the Bronx entirely.
July 18 is the cleanest reading of the year
On Saturday, July 18, CNN reported flash flooding across New York City after days of smoke and heat.
| Fri Jul 17 | Sat Jul 18 | Sun Jul 19 | |
|---|---|---|---|
| Manhattan | — | −17.0% | — |
| Queens | — | −16.2% | — |
| Five boroughs | +5.5% | −13.0% | +10.4% |
| Rest of New York | +5.0% | −1.4% | +2.8% |
| New Jersey | +8.0% | +1.7% | +5.4% |
Manhattan lost 17% of a Saturday and Queens 16%. The five boroughs together lost 13%. The rest of the state lost 1.4%. New Jersey gained.
In dollars: the five boroughs did $1,738,543 against an expected $1,997,639 — $259,096 that didn't happen, on the single biggest shopping day of the week.
This is the number that would have been invisible statewide. Blended into the full state series, July 18 reads as −5.1% and looks like an ordinary bad Saturday. It wasn't. It was a city-specific event, and now we can see it.
Notice the Sunday, though: +10.4% in the city against +2.8% upstate. Most of it came back the next day. Hold that thought.
Now the snow
Rain is a nuisance. Snow is a different category of event entirely.
| Manhattan | Brooklyn | Queens | Bronx | Staten Island | Rest of NY | |
|---|---|---|---|---|---|---|
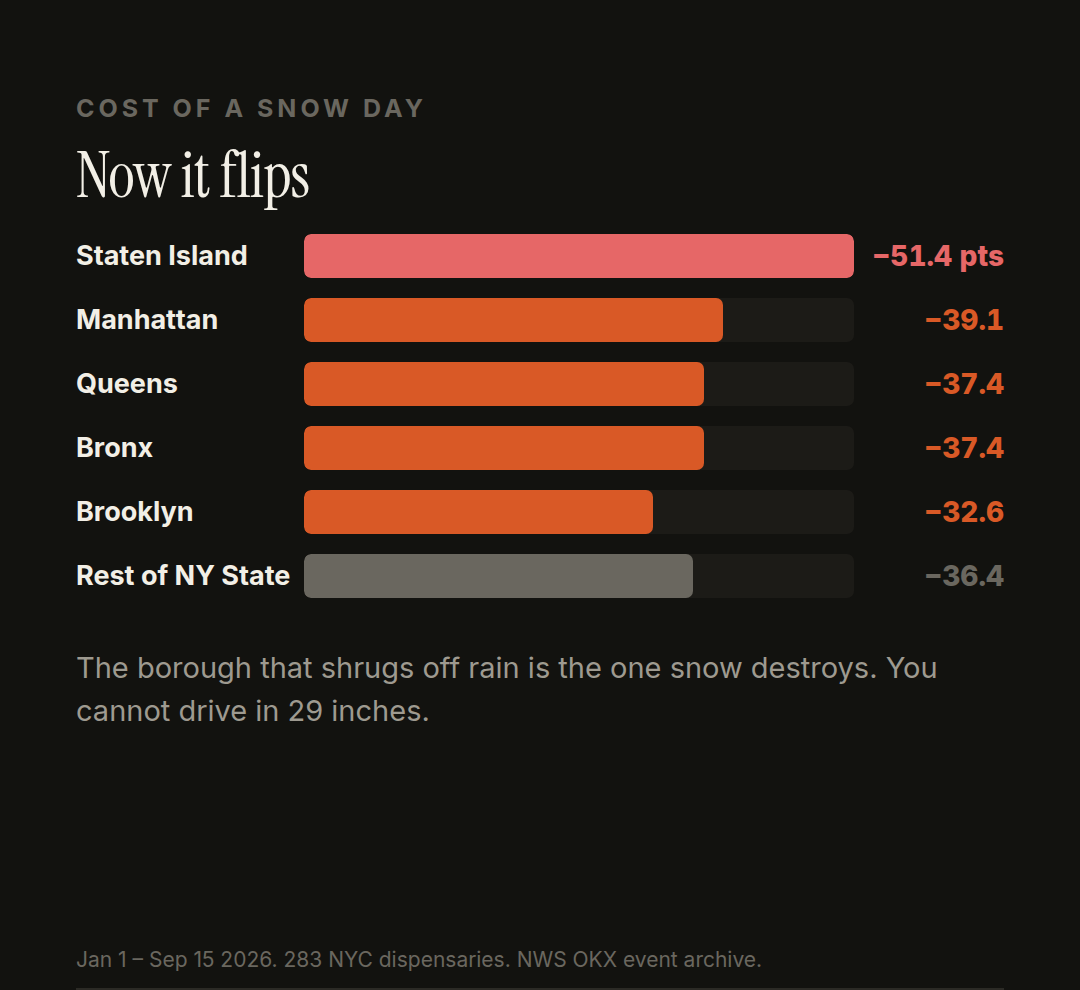
| Jan 25–26 — major winter storm | −39.1% | −35.0% | −41.6% | −39.5% | −52.7% | −48.7% |
| Feb 22–23 — blizzard | −37.1% | −22.6% | −24.0% | −26.8% | −41.6% | −13.7% |
Monday, February 23 is the worst day the five boroughs have had in 2026. The city's 283 dispensaries sold $521,823. A normal late-February Monday runs about $1.5 million. That is 35 cents on the dollar — and while the city was down 65%, the rest of New York State was down 40%.
That was the blizzard. Central Park measured 19.7 inches. LaGuardia and Mott Haven hit 23.4. Sheepshead Bay 22.5, Grasmere on Staten Island 29.0. Montauk Point clocked an 84 mph gust.
And here is the other half of the Staten Island story.
The borough that shrugs off rain is the borough snow destroys. Staten Island was hit hardest by both winter storms — down 52.7% in January and 41.6% in February, worse than any other borough on both.
On Monday February 23, Staten Island's fourteen dispensaries sold $3,019.
Against an expected $77,269. That is four cents on the dollar. The borough effectively closed. For comparison, Manhattan did $248,596 that day (−66.0%), Brooklyn $156,210 (−57.1%), Queens $82,706 (−69.6%), the Bronx $31,291 (−66.9%).
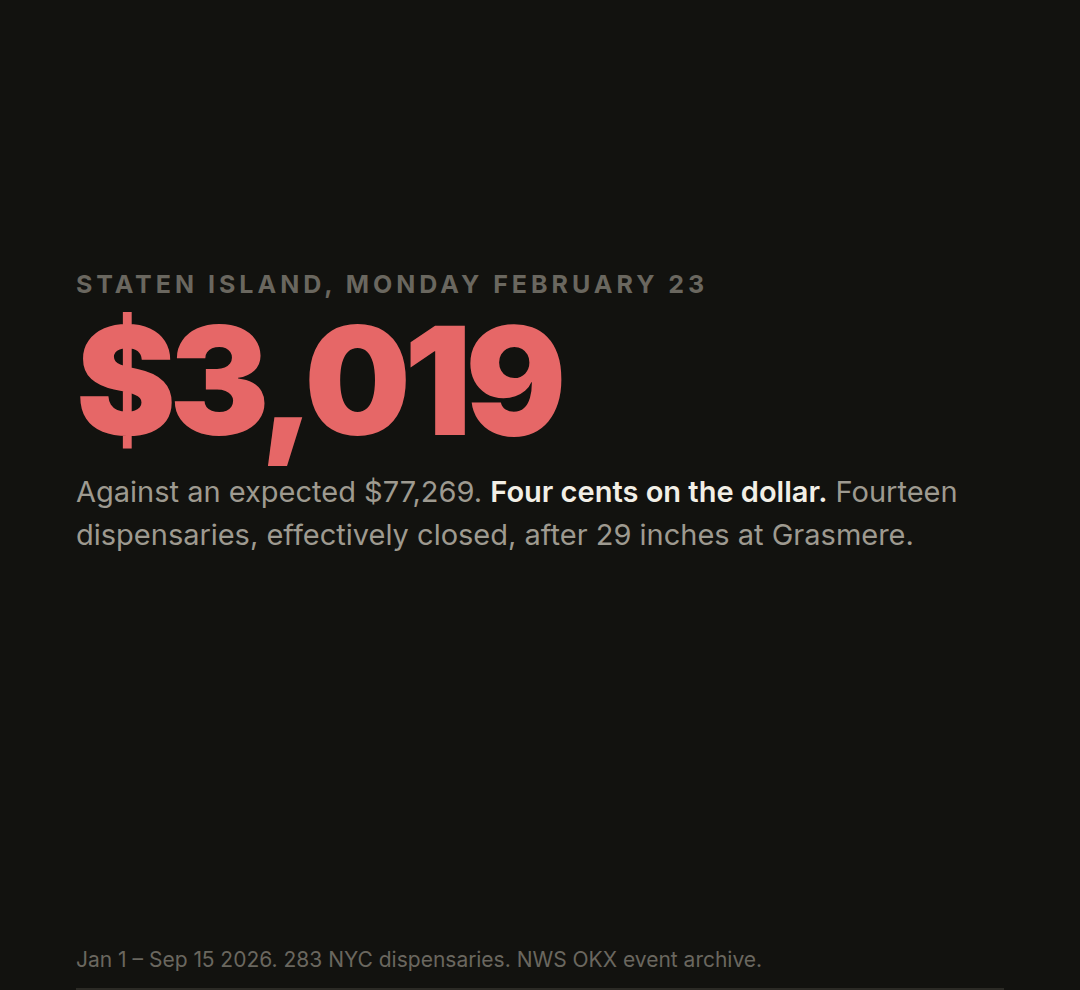
Staten Island took 29 inches of snow at Grasmere. You cannot drive in that, and on Staten Island driving is the only way most people get there. The very thing that makes it rainproof — a customer base in cars — is what makes it the most snow-fragile place in the region.
Rain is a tax on walking. Snow is a tax on driving. Once you can see the boroughs separately, the whole dataset says exactly that.
January's storm ran differently — it was broader and hit the whole state, so the rest of New York (−48.7%) fell harder than four of the five boroughs. Which is the point of splitting the data: the two worst weather days of the year had completely different geographies, and you cannot see that in a single statewide line.
The part that surprises people
Both blizzard weeks finished ahead.
| Five boroughs | Rest of NY | NJ | NYC net | |
|---|---|---|---|---|
| Jan 21 – 31 | +4.0% | +7.3% | +8.6% | +$734,776 |
| Feb 19 – 28 | +5.7% | +10.4% | +4.4% | +$994,334 |
Snow does not destroy cannabis demand. It moves it — forward into the stock-up, and back out into the rebound — and the two together more than cover the day the city loses.
Watch January in the five boroughs:
| Fri Jan 23 | Sat Jan 24 | Sun Jan 25 | Mon Jan 26 | Tue Jan 27 | |
|---|---|---|---|---|---|
| Sales | $2,661,496 | $2,410,070 | $585,565 | $1,137,749 | $1,480,954 |
| vs. expected | +32.9% | +43.4% | −59.0% | −19.2% | −2.5% |
Friday and Saturday ran 33% and 43% hot. Then the snow landed. Then it came back.
But note the city underperformed the rest of the state in both storm weeks — +4.0% against +7.3%, and +5.7% against +10.4%. The boroughs stock up less aggressively and rebound less completely than the rest of New York. A car trunk holds more than a tote bag, and an upstate customer who can't get out on Sunday simply goes Tuesday. In the city, some of those trips just don't happen.
What this says about the flooding specifically
This is the question that started the piece, so here is the straight answer.
Yes — the 2026 flooding is visible in five-borough sales, and it was invisible statewide. July 18 cost the city 13% of a Saturday. The May 20 storm that put standing water across the Cross Island, I-495, I-295 and the Grand Central Parkway held the city to +1.1% on a day the rest of the state did +6.1%. June 6 cost 6.8 points while upstate gained 3.7.
And the effect is real but small, and it does not last. No single flooding event in 2026 cost the five boroughs more than about a quarter of a million dollars, in a market that does roughly $1.9 million a day. Every one of them was recovered inside 48 hours. Rain reschedules a purchase. It does not cancel one.
One honest limitation: this resolves to whole boroughs, not to neighborhoods. When water fills Gowanus or Alphabet City, the stores on those blocks are certainly hit harder than a number covering all of Manhattan from the Battery to Inwood, or all of Brooklyn. Every level of zoom so far has made the effect larger, not smaller — statewide said 0, five boroughs said 5 points, Manhattan alone said 6 — which suggests the true figure for lower Manhattan on a flood day is bigger again. But we can't prove that without a ZIP-level split, so we're not claiming a number.
Two days we still can't explain
Thursday, February 5: the city fell 15.9% and the rest of the state 10.4%, while New Jersey ran 22.4% above expectation — a 38-point split between the city and New Jersey, the largest of the year.
Thursday, March 5: the city fell 23.4%, upstate 19.0%, New Jersey was flat at −1.0%. A New York-only event on both days.
Neither date appears anywhere in the National Weather Service's 2026 archive. We don't know what caused them, and we're not going to invent a storm to fill the gap.
For completeness: Sunday April 5 at −24.1% was Easter Sunday, and January 1 at −31.8% is New Year's Day. Both are holidays, not weather.
What to take from it
If you run a store in Manhattan or Queens: rain is a real, repeatable, 5–6 point headwind on the day, and you will get a dozen of them a year. It is also fully recovered by the following afternoon, so it's a staffing and delivery-capacity problem, not a demand problem. Don't discount into it — add riders.
If you run a store in Brooklyn or the Bronx: same pattern, about 3.5 points.
If you run a store on Staten Island: ignore rain entirely — it costs you under a point, less than it costs Buffalo. Spend that attention on snow instead, which hits you harder than anywhere else in the region. Your February 23 was a 96% loss.
If you run a store outside the city: most of this doesn't apply to you. Your customers are in cars, and your rain days look like ordinary days.
If you're planning for snow: the pre-storm spike is the whole game. Both major storms this year pulled the city's Friday and Saturday 30–43% above normal before the snow landed. Running out on the Saturday before a blizzard is the expensive mistake — and city stores already capture less of the rebound than upstate ones, so the days before are the days you get.
If you're reading market data: this is the lesson. The statewide series and the five-borough series disagreed on the central question of this article. One of them was averaging a walking city together with a driving state. Always ask what geography a number is describing.
Sales figures are estimated retail sell-through from third-party analytics, January 1 – September 15, 2026. Borough series: Manhattan 95 dispensaries / $221,289,490; Brooklyn 83 / $114,344,677; Queens 72 / $92,543,084; the Bronx 19 / $31,580,375; Staten Island 14 / $26,363,532. The five sum exactly to the 283-store, $486,121,158 New York City series, which is the reconciliation check used to validate the split. Statewide figures cover all 634 licensed New York dispensaries, $1,212,034,743; "rest of New York" is the statewide series minus the five boroughs. New Jersey covers all 311 licensed dispensaries. 258 complete trading days; the final day of each export is a partial pull and is excluded. Each day is compared against a day-of-week-adjusted expectation built from a centered rolling trend. Weather events, dates, snowfall totals and rainfall rates are from the National Weather Service New York (OKX) significant weather events archive and its individual event pages. The city series resolves to the five boroughs as a unit, not to individual boroughs or neighborhoods. Dollar totals are estimates and differ modestly from the state's own reported figures; day-over-day comparisons within a series are the firmest numbers here.
Sources: NWS New York significant events archive · May 20, 2026 severe thunderstorms and NYC flash flooding · February 22–23, 2026 blizzard · January 25–26, 2026 major winter storm · CNN, July 18, 2026 NYC flash flooding · NY1, February 2026 blizzard coverage
Words by Greg Silverstein · @NewYork420week · @sourcatjack