Research /Research
All Five Boroughs Sold Less Weed on Knicks Nights. Nowhere Else Did.
Nineteen playoff games, a 53-year drought broken. We pulled sales seven ways — each borough separately, the rest of the state, and New Jersey. Every borough went down. Manhattan, where the Garden is, went down five times harder than New Jersey went up.
On June 13, the Knicks beat the Spurs 94–90 in San Antonio and won their first championship since 1973. Jalen Brunson scored 45.
That night, Manhattan's 95 licensed dispensaries sold 0.9% below a normal mid-June Saturday. The rest of New York State was up 1.8%. New Jersey — no team, no stake — was up 5.9%.
That is not a fluke of one evening. Across all nineteen playoff games, every one of the five boroughs sold less on game nights than on the ordinary nights around them, and nowhere outside the city did. Manhattan's hole is the deepest by a distance.
It gets clearer the closer you look.
How you test something like this
Cannabis sales in New York are up about 30% this year. A rising line agrees with any story you tell about it, so "sales were strong during the playoffs" means nothing on its own.
So we built three comparisons.
Day of the week. Friday is worth far more than Monday. Every day here is measured against its own weekday.
Geography, seven ways. All five boroughs separately — Manhattan (95 stores, $221M, the borough with the arena in it), Brooklyn (83, $114M), Queens (72, $93M), the Bronx (19, $32M) and Staten Island (14, $26M) — plus the rest of New York State (Long Island, Westchester, the Hudson Valley, Albany, Syracuse, Rochester, Buffalo) and New Jersey. The five boroughs sum exactly to the citywide total, which is how we know the split is clean. Knicks fever is a New York City phenomenon, and most of all a Midtown one. If it moves cannabis sales, it should move them in Manhattan and not in Buffalo.
A third state. New Jersey, which had no team in the playoffs.
If the Knicks sold weed, the five boroughs should pull away from the other two on game nights. That is the whole test.
The nineteen games
Start at city level — all five boroughs together — then we'll zoom in.
| Date | Game | H/A | Five boroughs | Rest of NY | NJ | Gap |
|---|---|---|---|---|---|---|
| Sat Apr 18 | R1 G1 vs ATL | H | +15.0% | +19.6% | +15.8% | −4.5 |
| Mon Apr 20 | R1 G2 | H | +103.8% | +112.0% | +107.0% | −8.2 |
| Thu Apr 23 | R1 G3 | A | −5.0% | −10.0% | −9.9% | +5.0 |
| Sat Apr 25 | R1 G4 | A | −11.1% | −3.0% | −2.9% | −8.1 |
| Tue Apr 28 | R1 G5 | H | +1.4% | −0.4% | +0.5% | +1.8 |
| Thu Apr 30 | R1 G6 | A | +6.3% | +5.8% | −1.0% | +0.4 |
| Mon May 4 | ECSF G1 vs PHI | H | +3.2% | +3.8% | +3.6% | −0.5 |
| Wed May 6 | ECSF G2 | H | +2.8% | +8.3% | +4.0% | −5.4 |
| Fri May 8 | ECSF G3 | A | +7.3% | +6.5% | +2.2% | +0.8 |
| Sun May 10 | ECSF G4 | A | −2.4% | +3.6% | +2.5% | −6.0 |
| Tue May 19 | ECF G1 vs CLE | A | +2.9% | +4.8% | +9.2% | −1.8 |
| Thu May 21 | ECF G2 | A | +10.4% | +10.1% | +13.1% | +0.2 |
| Sat May 23 | ECF G3 | H | −3.5% | +11.0% | +8.4% | −14.5 |
| Mon May 25 | ECF G4 | H | +2.2% | +1.8% | +11.5% | +0.5 |
| Wed Jun 3 | FIN G1 vs SAS | A | +6.5% | +5.0% | +3.6% | +1.5 |
| Fri Jun 5 | FIN G2 | A | −4.8% | +2.0% | −0.5% | −6.9 |
| Mon Jun 8 | FIN G3 | H | +7.8% | +7.4% | +2.3% | +0.4 |
| Wed Jun 10 | FIN G4 | H | −1.6% | +5.0% | +3.6% | −6.6 |
| Sat Jun 13 | FIN G5 — clinch | A | −0.6% | +1.8% | +5.9% | −2.4 |
The five boroughs finished below the rest of the state on 11 of the 19 games.
The single widest gap is Game 3 of the Conference Finals — a Saturday night home game, the Knicks up 2–0 against Cleveland, the Garden as loud as it gets. The city did −3.5%. The rest of the state did +11.0%.
The 4/20 problem, and why it settles things
One row in that table is enormous, and it is the reason this needed control groups.
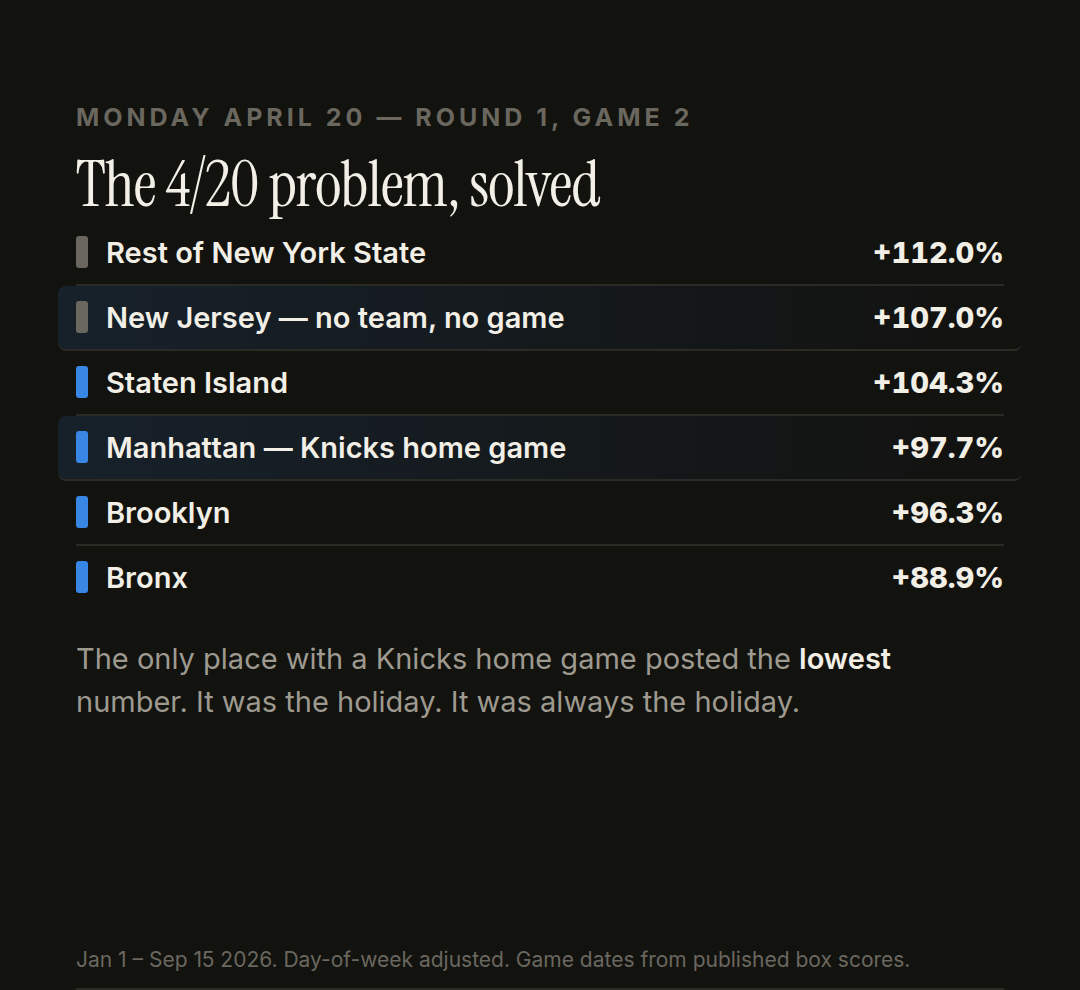
Game 2 of the first round was played on Monday, April 20.
The five boroughs did $3,189,276 — more than double a normal Monday. If you wanted to argue Knicks fever drove the city's cannabis market, that one number would carry the article.
Except the rest of New York State was +112.0%, and New Jersey — no team, no game — was +107.0%.
The five boroughs, the only place with a Knicks home game that night, posted the lowest of the three.
It was the holiday. It was always the holiday. The Knicks just tipped off inside it.
The formal answer
During the run — April 18 through June 13, 57 days — with April 20 excluded from every column:
| Game days | Non-game days | Game-night lift | |
|---|---|---|---|
| Five boroughs | +2.05% | +3.72% | −1.67 pts |
| Rest of New York | +4.61% | +4.72% | −0.11 pts |
| New Jersey | +4.00% | +2.43% | +1.57 pts |
The city sold less on game nights than on the ordinary nights around them. The rest of the state was flat. New Jersey, with no dog in the fight, was the only one of the three that went up.
Net the city against its controls and the Knicks effect in the five boroughs comes out at −1.6 points against the rest of New York and −3.2 points against New Jersey.
It holds when you split home from away:
| Five boroughs | Rest of NY | NJ | |
|---|---|---|---|
| Home games (n=8) | +3.44% | +7.05% | +6.22% |
| Away games (n=10) | +0.95% | +2.66% | +2.22% |
The city is last in both. On the nights the team played at the Garden — the nights when, if there were ever going to be a New York City cannabis effect, it would appear — the five boroughs trailed the rest of their own state by 3.6 points.
It got worse as the stakes got higher
| Round | Five boroughs | Rest of NY | NJ |
|---|---|---|---|
| Round 1 vs. Atlanta | +8.92% | +8.74% | +6.62% |
| Conf. semis vs. Philadelphia | +4.47% | +6.43% | +4.98% |
| Conf. finals vs. Cleveland | +3.86% | +10.61% | +10.72% |
| NBA Finals vs. San Antonio | +0.34% | +3.30% | +1.42% |
Round by round, the city falls further behind. By the Finals — the first Knicks Finals in a generation — the five boroughs were running essentially flat, at +0.34%, while the rest of the state did +3.30%.
Over the whole 57 days, the five boroughs came in at +4.63% against the rest of New York's +6.27%. During the greatest run in 53 years, New York City's cannabis market grew slower than the state around it.
"They just bought the night before"
This is the first objection anyone raises, and it's a fair one. If you're settling in for a playoff game, you stock up beforehand. The purchase doesn't disappear — it moves to the evening before.
So we ran all nineteen game-eves the same way.
| Night before a game | Ordinary night | Lift | |
|---|---|---|---|
| Five boroughs | +3.33% | +3.55% | −0.22 pts |
| Rest of New York | +5.07% | +3.40% | +1.67 pts |
| New Jersey | +2.38% | +1.35% | +1.03 pts |
(April 19 excluded — it's 4/20 eve.)
The rest of the state stocked up. New Jersey stocked up. The five boroughs didn't.
That's the opposite of what the objection predicts, and it's worth sitting with. Upstate New York — where you already drive to the dispensary, where you already buy in larger trips — added 1.7 points on the night before a Knicks game. The city, where the team actually plays, added nothing.
And the pattern sharpens as the games get bigger:
| Night before | Five boroughs | Rest of NY | NJ |
|---|---|---|---|
| Wed Apr 29 — close-out vs. ATL | +2.93% | +1.81% | +0.45% |
| Sat May 9 — sweep vs. PHI | +2.75% | +9.49% | +11.27% |
| Sun May 24 — sweep vs. CLE | −0.61% | +16.30% | +10.89% |
| Fri Jun 12 — eve of the title | −5.19% | +2.18% | +2.72% |
The night before the Knicks won the championship, the five boroughs sold 5.2% below a normal Friday, while the rest of the state was up 2.2% and New Jersey up 2.7%.
The gradient
Put all four kinds of day side by side, and split the city into Manhattan — where the Garden is — and the other four boroughs.
| Ordinary day | Night before | Game night | Day after | |
|---|---|---|---|---|
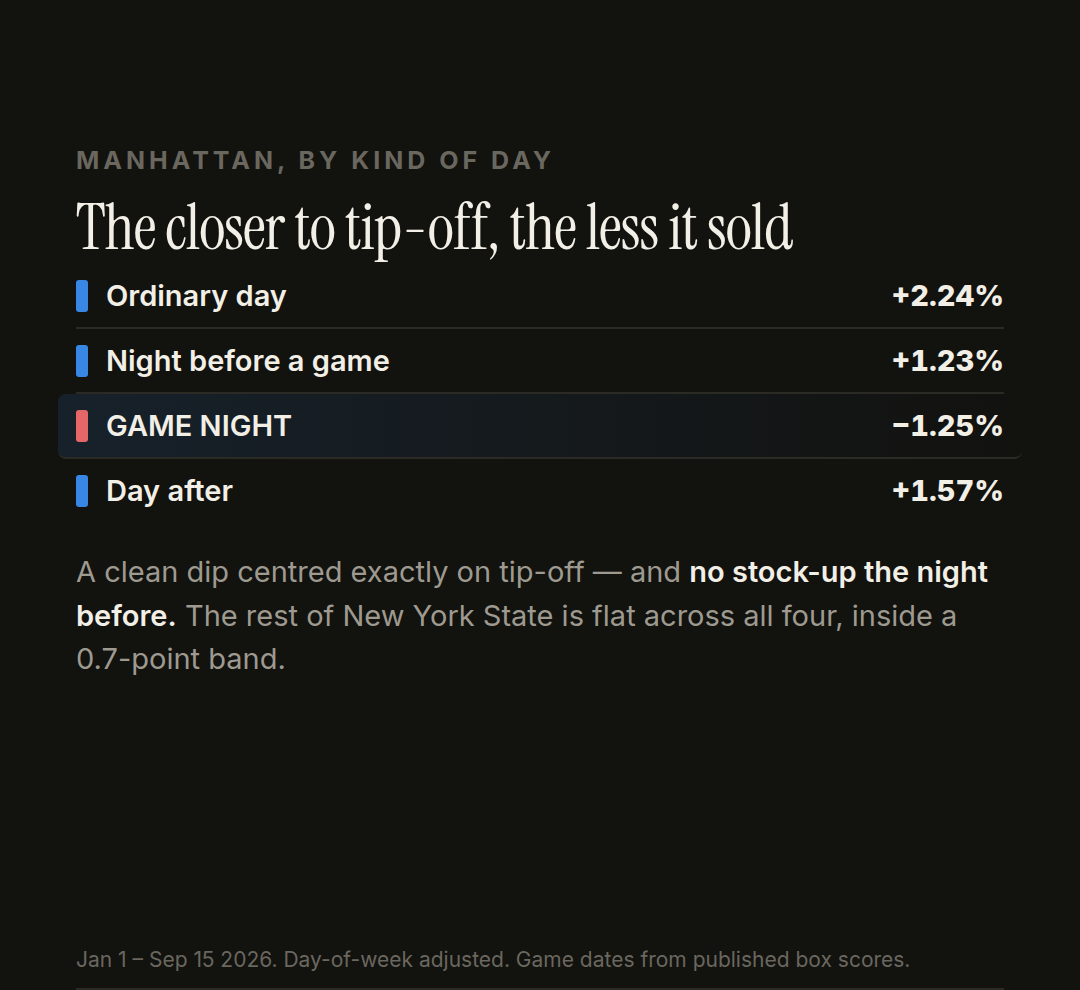
| Manhattan | +2.24% | +1.23% | −1.25% | +1.57% |
| Brooklyn | +3.48% | +3.80% | +3.21% | +3.76% |
| Queens | +6.21% | +6.30% | +3.78% | +6.33% |
| Bronx | +6.39% | +3.69% | +4.48% | +3.46% |
| Staten Island | +3.31% | +2.34% | +2.56% | +3.70% |
| Rest of New York | +4.36% | +5.07% | +4.61% | +4.59% |
| New Jersey | +1.90% | +2.38% | +4.00% | +2.71% |
Read Manhattan's row left to right. It descends from +2.24% on an ordinary day, to +1.23% the night before, to −1.25% on game night — the only negative number in the table — then recovers to +1.57% the next day.
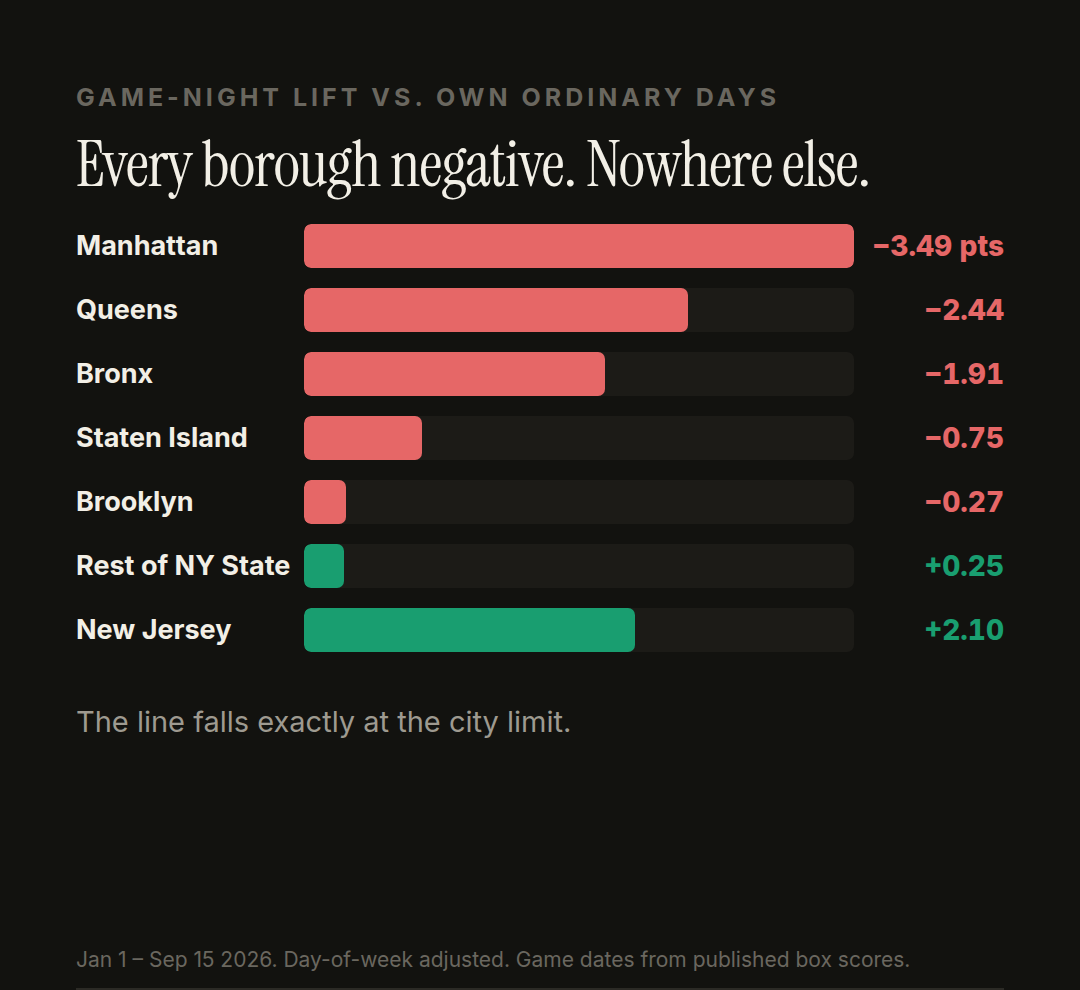
Measured as game-night lift against each area's own ordinary days:
| Game-night lift | |
|---|---|
| Manhattan | −3.49 pts |
| Queens | −2.44 pts |
| Bronx | −1.91 pts |
| Staten Island | −0.75 pts |
| Brooklyn | −0.27 pts |
| Rest of New York | +0.25 pts |
| New Jersey | +2.10 pts |
Every one of the five boroughs is negative. Nowhere outside the city is. That line — between the last borough and the rest of the state — is the finding.
It is not a perfect distance gradient, and we're not going to pretend it is: Brooklyn is closer to the Garden than Queens or Staten Island and shows the smallest effect of the five. But Manhattan is decisively the deepest, at more than five points below where New Jersey landed, and the city-versus-everywhere-else split is clean across all seven geographies. That is about as close to a fingerprint as daily retail data gets.
The Garden test
Here is the sharpest version of it. Take only the games played at Madison Square Garden:
| Home games (n=8) | Away games (n=10) | |
|---|---|---|
| Manhattan | −0.61% | −1.77% |
| Staten Island | +2.74% | +2.42% |
| Brooklyn | +5.76% | +1.17% |
| Bronx | +6.09% | +3.20% |
| Queens | +6.85% | +1.32% |
| Rest of New York | +7.05% | +2.66% |
| New Jersey | +6.22% | +2.22% |
On the nights the Knicks played at Madison Square Garden, Manhattan was the only geography in the entire region that went backwards. Everywhere else in the tri-state had a good night — Queens up 6.9%, the rest of the state up 7.1% — and the borough containing the arena was down.
Two of those nights are remarkable:
| Manhattan | Brooklyn | Queens | Bronx | Staten Island | Rest of NY | |
|---|---|---|---|---|---|---|
| Sat May 23 — ECF Game 3 | −12.0% | −5.4% | +4.3% | +5.8% | +5.1% | +11.0% |
| Mon May 25 — ECF Game 4 | −12.0% | +13.3% | +13.0% | +3.6% | +12.6% | +1.8% |
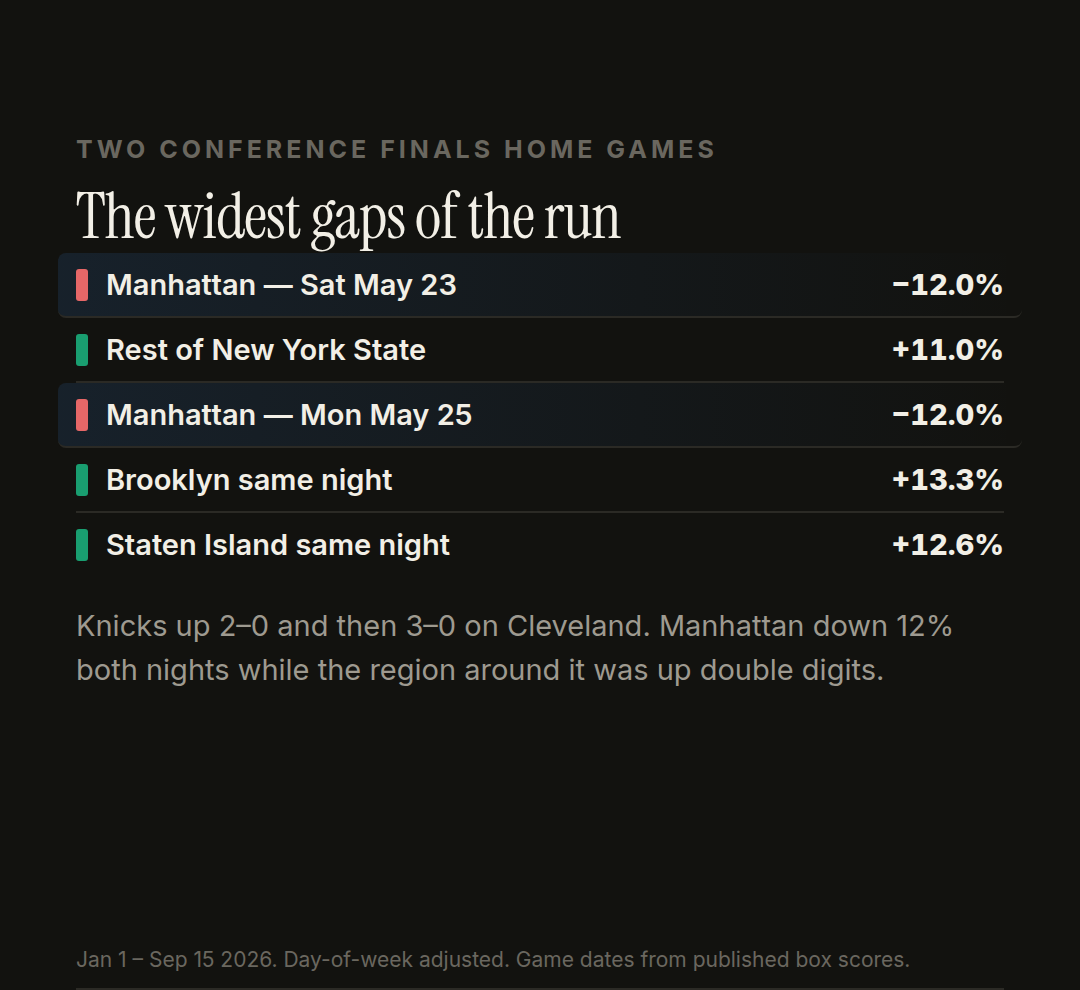
Two Conference Finals home games, a Saturday and a Monday, the Knicks going up 2–0 and then 3–0 on Cleveland, the Garden as loud as it has been in fifty years. Manhattan dispensaries sold 12% below normal on both — while on the Monday every other borough was up double digits.
This is the question we flagged as unanswerable last week, and the answer turned out to be the opposite of the guess. There is no Garden-adjacent bump. There is a Garden-adjacent hole.
So what's actually happening
The obvious reading is the right one: people were watching.
A playoff game is three hours of sitting still, at home or in a bar, with your phone in your hand and your attention on a screen. It is not an occasion that generates a trip to a dispensary. It competes with one. And in a city where buying weed means walking somewhere or waiting on a delivery, an evening you have committed to a television is an evening the store doesn't see you.
And it explains why the hole is deepest in Manhattan. Midtown is where the arena is, where the sports bars are, and where the after-work crowd that would otherwise stop somewhere on the way home instead goes to watch the game. A Manhattan dispensary at 8pm on a Knicks night is competing with 20,000 people inside the building and several hundred thousand more committed to a screen.
That reading is supported by the shape of the recovery. The day after a game ran +1.57% in Manhattan — back above water and most of the way to an ordinary day. Whatever Midtown didn't buy on Thursday, it largely bought on Friday.
It also explains why the night before is flat rather than elevated. You don't make a special trip to stock up for something you watch nineteen times in eight weeks. A playoff run isn't a holiday you prepare for — it's a routine that quietly eats your evenings, and the purchase slides to whenever you were next going to be out anyway.
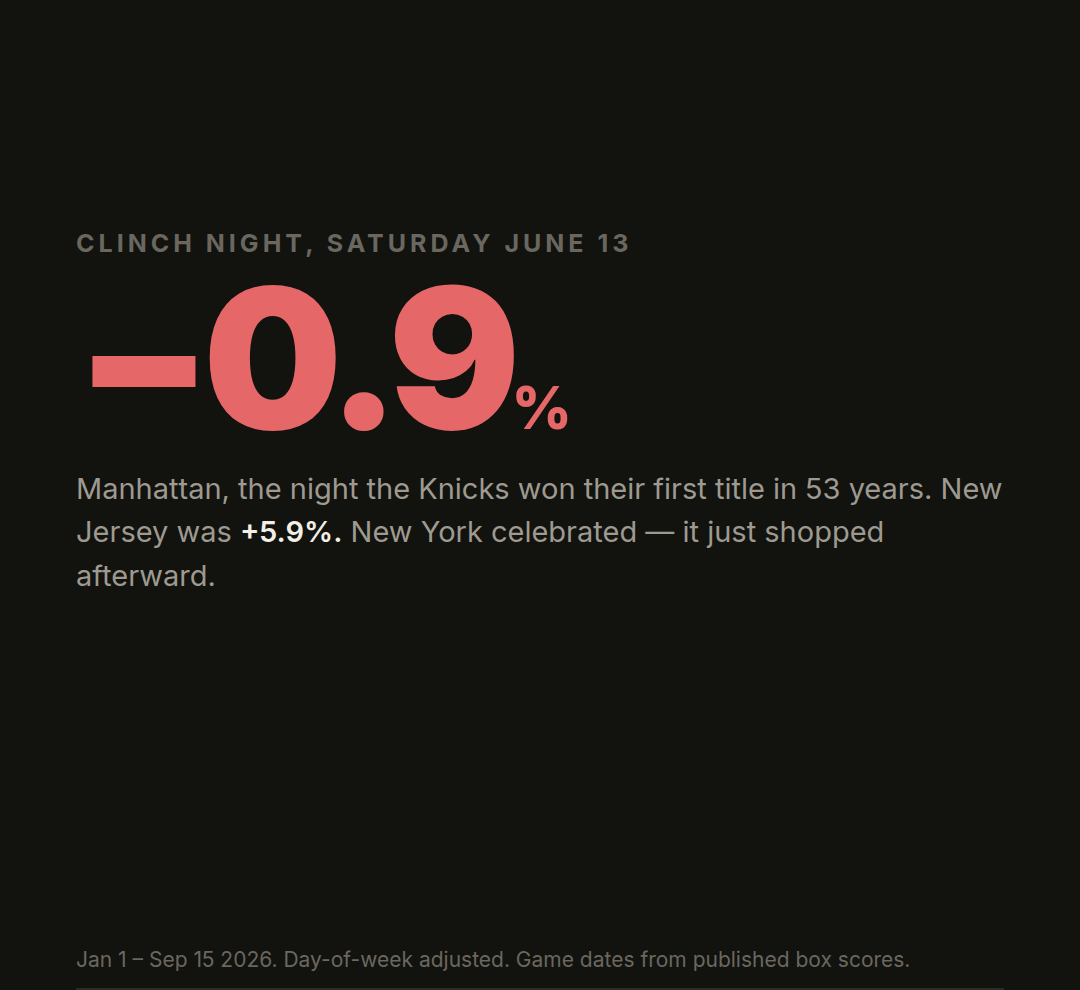
And it lines up with the clinch. The championship was won on a Saturday night — normally the second-biggest shopping day of the week. Manhattan did −0.9%, and the night before it did −4.0%. Then the city spent the following week comfortably ahead of the rest of the state. New York celebrated. It just did the shopping afterward.
What does move this market
For contrast, here is what actually shows up in five-borough sales:
4/20. $3,189,276 in a day — more than double a normal Monday.
Friday. The biggest day of the week, every week, all year.
Blizzards. February 23 fell to $521,823, 35 cents on the dollar, after two feet of snow.
Rain. A storm day costs the city roughly 5% — and July 18's flash flooding cost it 13% of a Saturday.
Every one of those changes whether a person can physically get to a store. A basketball game changes whether they feel like it. The first category moves millions. The second, it turns out, moves nothing — or moves it slightly the wrong way.
One limitation, stated plainly
This resolves to Manhattan as a whole — 95 stores from the Battery to Inwood — not to the blocks around the arena.
Every level of zoom so far has made the effect larger: statewide showed nothing, the five boroughs showed −2.3 points, Manhattan alone shows −3.49. If the signal really is concentrated in Midtown, the number for the stores within walking distance of 33rd and Seventh is bigger again. We can't prove that without a ZIP-level split, so we're not putting a figure on it.
What this data does say, with six independent geographic comparisons: Manhattan sold less on Knicks nights than on ordinary nights, it was the only geography in the tri-state to go negative on home games, and all five boroughs moved the same direction while nothing outside the city did.
What to take from it
If you run a Manhattan store: a Knicks home game is a soft night — the softest recurring night on your calendar that isn't weather. Staff it like a slow Tuesday and stop treating a playoff run as an opportunity. Don't build promotions around the night before either; that came in below ordinary too.
If you run a store in the outer boroughs: the same effect exists but at roughly two-thirds the size. Worth knowing, not worth restructuring around.
If you're a brand: a sports sponsorship may still be worth it for brand-building. It is not worth it for same-day sell-through, and the data argues specifically against a game-night activation in Manhattan. If you want the basketball audience, the morning after is where the transaction is.
If you cover this industry: be very careful with "sales surged during the Knicks run." They did — and they surged least in the borough with the arena in it. Without a geographic control, every spring event in New York looks like a winner.
And if you were at the parade: so was everyone. It still didn't show up in the receipts.
Sales figures are estimated retail sell-through from third-party analytics, January 1 – September 15, 2026. Borough series: Manhattan 95 dispensaries / $221,289,490; Brooklyn 83 / $114,344,677; Queens 72 / $92,543,084; the Bronx 19 / $31,580,375; Staten Island 14 / $26,363,532. The five sum exactly to the 283-store, $486,121,158 citywide series, which is the reconciliation check used to validate the split. "Rest of New York" is the full 634-store statewide series minus the five boroughs. New Jersey covers all 311 licensed dispensaries. 258 complete trading days; the final day of each export is a partial pull and is excluded. Each day is compared against a day-of-week-adjusted expectation built from a centered rolling trend. Game-night effects are reported as the difference between game days and non-game days within the same April 18 – June 13 window, then compared across the three geographies; April 20 is excluded from that calculation because it is 4/20, and April 19 is excluded from the night-before calculation because it is 4/20 eve. In the four-way gradient table, "night before" and "day after" are the calendar days immediately adjacent to each game; where a series played every other day, a single date can be both, and such dates are counted in both columns. "Ordinary day" is every remaining day inside the run window. The city series resolves to the five boroughs as a unit, not to individual boroughs, neighborhoods or stores. Dollar totals are estimates and differ modestly from the state's own reported figures; comparisons within a series are the firmest numbers here. Game dates, results and scores verified against published box scores.
Sources: 2026 NBA Finals · 2026 NBA playoffs · Basketball-Reference, Game 5 box score · ESPN, Knicks 94–90 Spurs recap · NBA.com, Knicks win the 2026 championship · CBS Sports, Brunson scores 45 in clincher
Words by Greg Silverstein · @NewYork420week · @sourcatjack