Research /Research
New York Is Selling More Weed Than Ever. It’s Also Getting Cheaper Every Month.
$1.17 billion in legal sales so far this year, 1,150 brands, 630 stores — and 300 more on the way. Here’s what’s actually happening inside the country’s newest big cannabis market.
Three and a half years ago, New York’s legal cannabis market was one store on Broadway in NoHo. Today it’s a billion-dollar-a-year business with more than 600 licensed dispensaries — and by the state’s own count, it went from 261 stores to 556 in 2025 alone. It more than doubled in a single year.
You’ve probably seen the milestone headlines. $2.5 billion in cumulative sales by last November. The 600th store in March. Roughly $1.5 billion sold in 2025.
What the headlines don’t tell you is what’s going on inside the market: what people are buying, which brands are winning, where the money is, and what happens to a dispensary’s economics when the state keeps opening new ones a few blocks away.
So I built a model. It covers every day from January 1 through September 6, 2026–630 dispensaries, 1,150 brands, 12 product categories — using Lit Alerts’ New York market data sets: daily, category, brand and store-level sales estimates that Lit Alerts builds by sampling dispensary menus. That’s the important caveat: these are estimates, not register data, and I’ll come back to what that means at the end.
Here’s what it shows.
First, how we got here
New York’s first legal sale rang up at Housing Works Cannabis Co, at 750 Broadway in NoHo, on December 29, 2022. Since then the market has grown faster than any big state before it, almost entirely because of how fast stores opened.
2023 did about $150 million with 40 stores open by year-end. 2024 did $869 million with 260. 2025 did roughly $1.5 billion with 556. And 2026 is on pace for $1.7 to $1.8 billion.
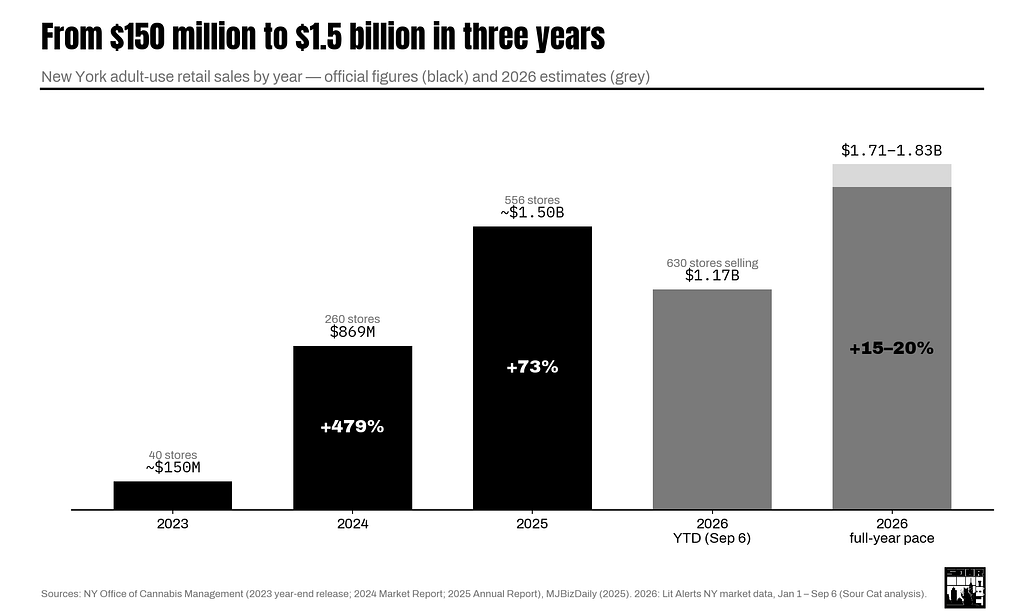
That’s growth of roughly 480%, then 73%, then — this year — something like 15 to 20%. The market is maturing. But “maturing” in New York still means a new dispensary every couple of days.
$1.17 billion and counting
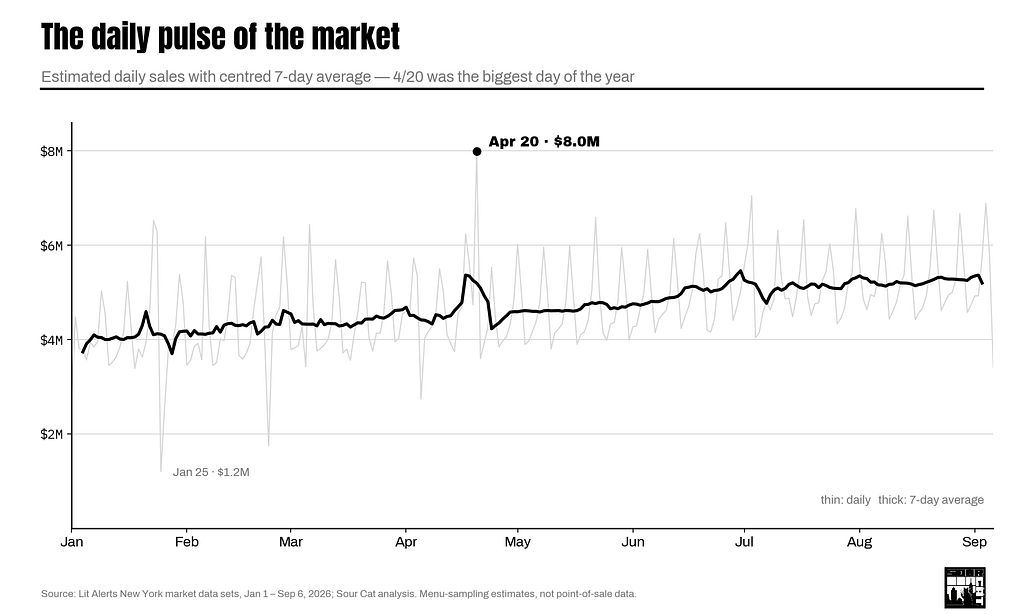
Through September 6, New Yorkers bought an estimated $1.17 billion of legal cannabis — about 33 million items at an average of $35.26 each. That’s $4.7 million a day, and the daily number keeps climbing: $4.06 million a day in January, $5.20 million in August, $5.28 million in the first week of September. Up 30% in eight months.
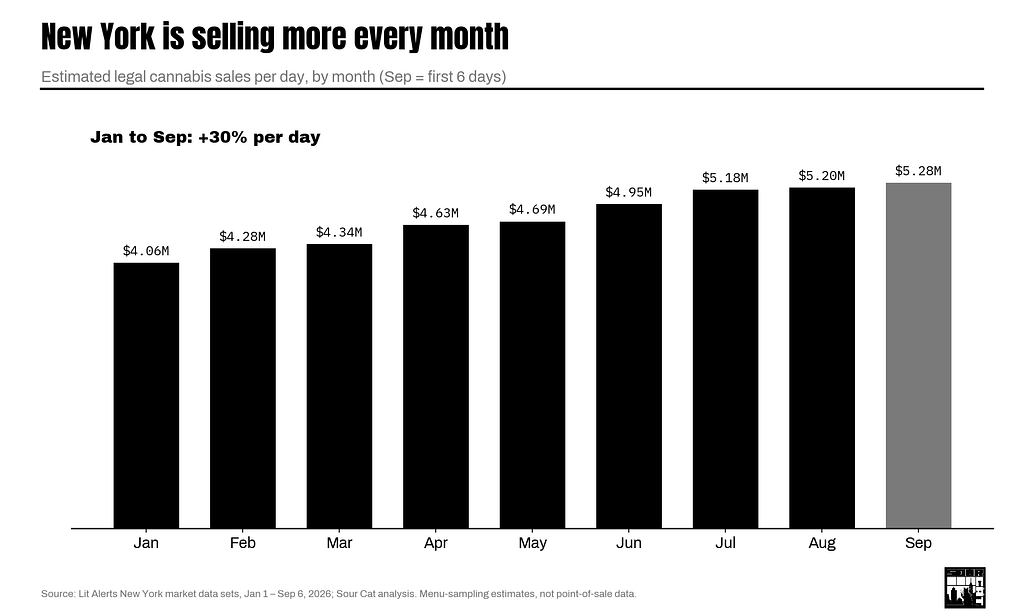
Hold the last 30 days’ pace flat and the state finishes the year around $1.77 billion. Extend the trend and it’s closer to $1.83 billion. Either way, that’s before the fourth-quarter holiday bump.
The biggest single day of the year was — you guessed it — April 20, at $8.0 million, about 70% above a normal day. Check out our coverage of New York 420 Week. The next four biggest days were all Fridays, two of them the Fridays before July 4th and Labor Day. The smallest day was a Sunday in late January, at $1.2 million.
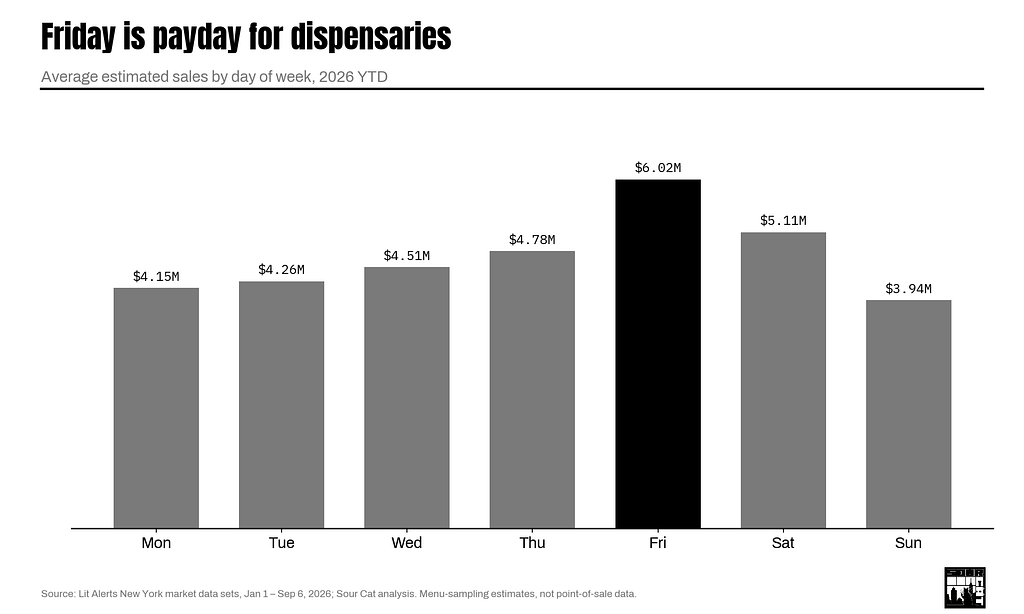
If you run a store or a brand, the weekly rhythm matters more than the annual number. Fridays average $6.0 million. Sundays average $3.9 million. Friday alone is nearly a fifth of the week; Thursday and Saturday are the only other days above average.
The growth is volume, not price
Here’s the part operators won’t love. The average item sold for $36.85 in January and $34.07 in early September — down 7.6%, and the slide shows up almost every month.
For consumers, this is what “the legal market is finally competing with the illicit one” looks like. For anyone with money in a dispensary, it means the growth is coming from more transactions and more stores, and the margin is being competed away. Keep that in mind for everything below.
Pre-rolls are eating the category mix
Four products account for 93 cents of every dollar: flower (33%), vapes (28%), pre-rolls (20%) and edibles (12%). Concentrates are 3%; everything else — tinctures, drinks, topicals, accessories, apparel — shares the last 3%.
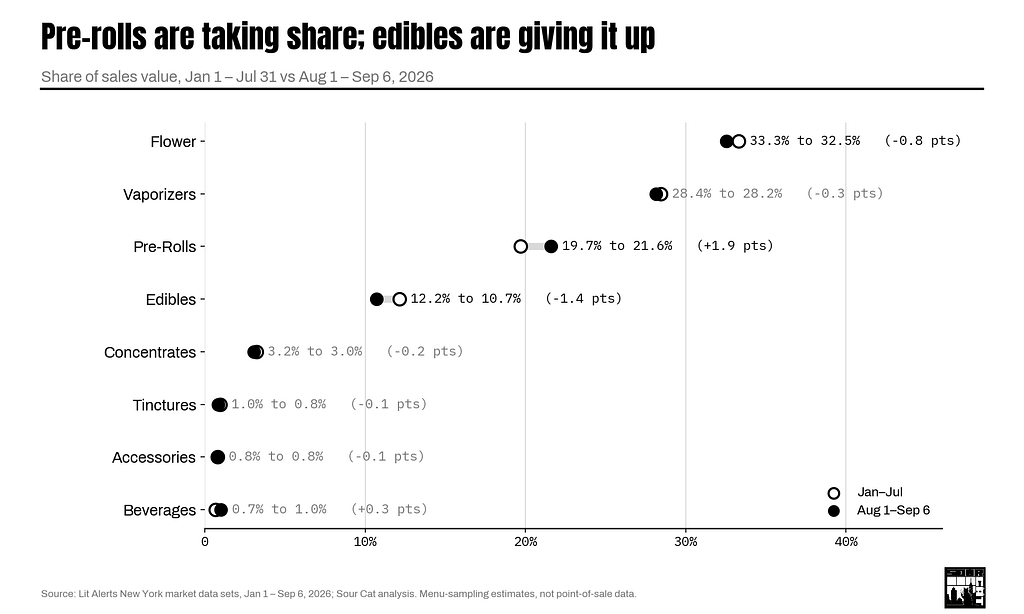
The interesting movement is inside that top four. Comparing January through July with August 1 through September 6:
Pre-rolls went from 19.7% of sales to 21.6%. Daily pre-roll sales rose 27% between the two windows, against 16% for the market overall.
Edibles slipped from 12.2% to 10.7%. Daily edible sales grew just 3% while the market grew 16%.
Flower and vapes held their share. Both moved less than a point.
Beverages are still tiny — about 1% — but grew fastest of anything, up 72% per day.
The pre-roll story is a price story. The average pre-roll item goes for about $23. Flower is $55; a vape product is $52. As prices compress and the customer base widens beyond enthusiasts, the cheapest, most convenient format wins.
Nobody owns New York
If you’re used to mature markets where a handful of brands dominate, New York will surprise you. It is extraordinarily fragmented.
1,150 brands showed up on New York menus this year. The biggest, ayrloom, has 4.2% of branded sales — about $45 million. Only two others, Rythm and Jaunty, clear 2.75%. The top 10 brands combined hold 23%. You need the top 100 to get to 77% of the market.
Economists measure concentration with something called the Herfindahl-Hirschman Index; anything under 1,500 is “unconcentrated.” New York’s is about 121.
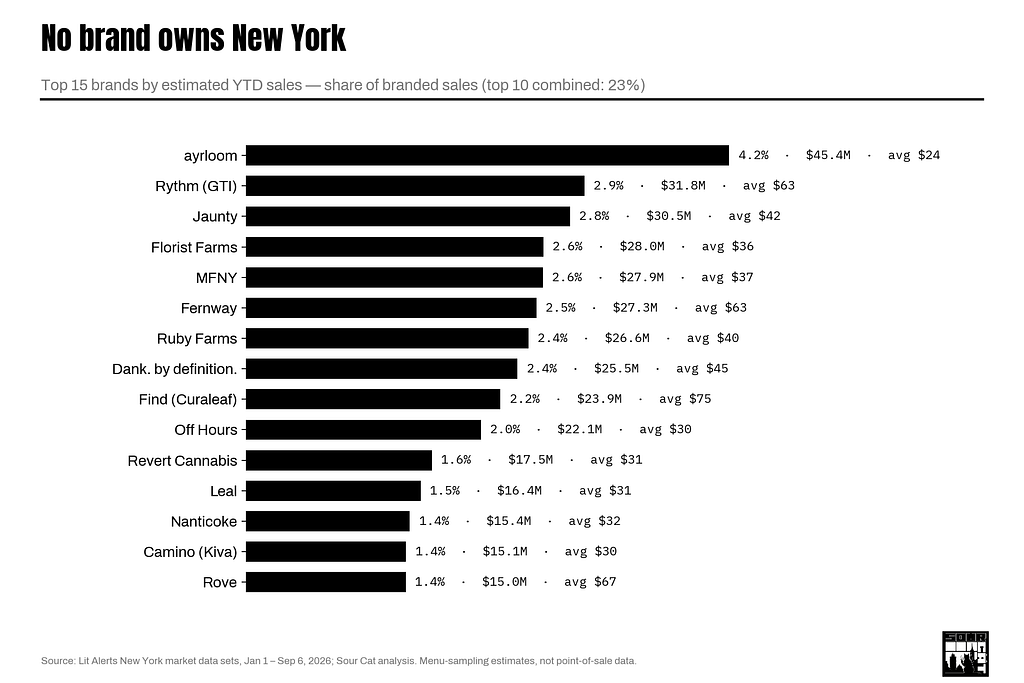
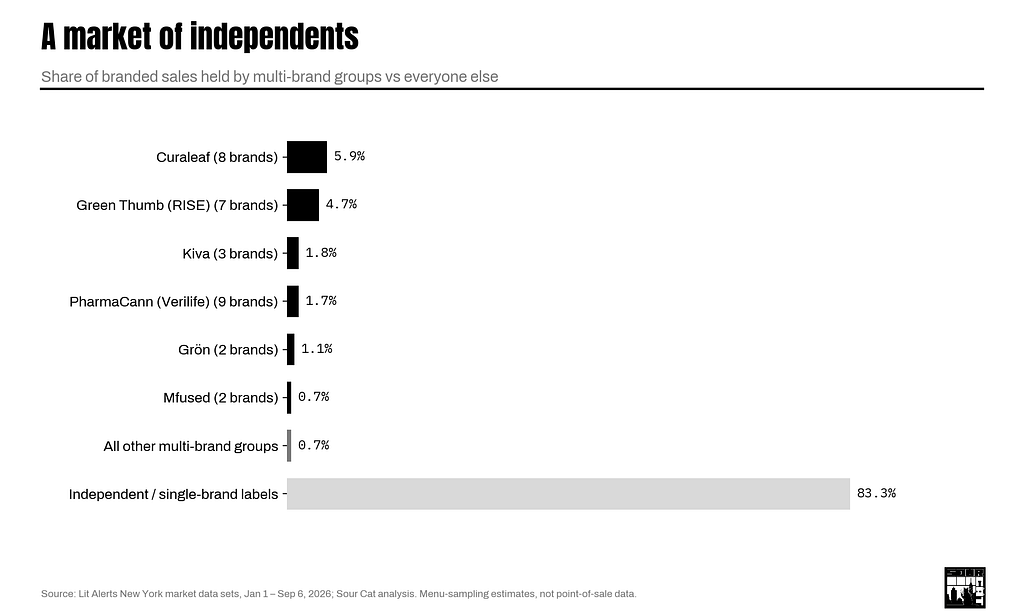
The multi-state operators are here, but they aren’t running things. Add up Curaleaf’s eight labels (Find, Select, Grassroots, Anthem, JAMS and others) and you get 5.9% of branded sales. Green Thumb’s seven (Rythm, Good Green, Dogwalkers and others) get 4.7%. Kiva has 1.8%, PharmaCann’s Verilife labels 1.7%. Every multi-brand group together: about 17%. Independent and single-brand labels have the other 83%.
Two more things the brand data tells you.
The $30–45 item is the center of the market. Brands whose average item sells for $30 to $45 take 44.7% of the dollars and an almost identical 43.7% of the units. Value brands under $15 move 5.4% of units for 1.3% of dollars. Premium brands over $65 move 6.2% of units for 13.5% of dollars. The mass middle is where the money lives.
Momentum belongs to the newcomers. Comparing each brand’s summer sales rate against the rest of the year, the fastest risers among million-dollar brands were Papa’s Herb (+295%), No Bad Days (+172%), Jive (+123%), Claybourne Co (+108%) and Lowell Farms (+103%) — mostly launches ramping through the year. The steepest fallers were PUFF (−55%), a cluster of PharmaCann labels (CAM −35%, matter. −30%, Magnitude −23%, LivWell −19%) and Ghost (−31%).
One note on method: these rankings come from what’s on every store’s menu, weighted by how fast it moves — including the hundreds of small independents that never show up in point-of-sale panels. That’s why some familiar national names sit lower here than you might expect.
The median store does $1.2 million. Six do over $10 million.
630 dispensaries recorded sales this year, and the gap between the top and the middle is enormous.
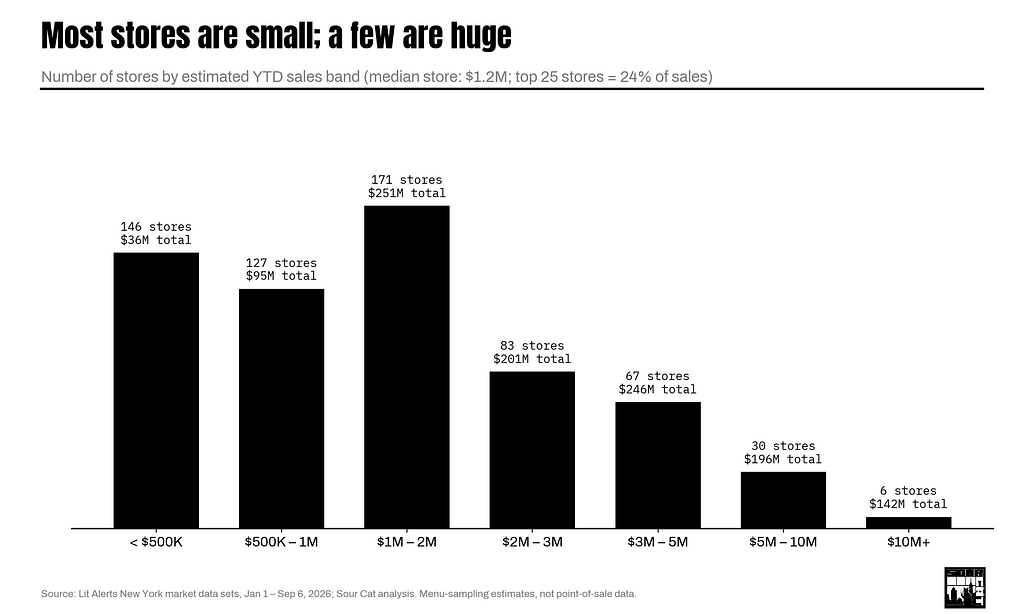
The median store has sold $1.21 million year to date. The average is $1.85 million, pulled up by a few giants. 146 stores are under $500,000 — about half of them opened this year — while 171 stores sit in the $1–2 million band, the fattest part of the curve.
At the top: 36 stores over $5 million, six over $10 million. The two biggest in the state, Strain Stars ($45.8 million) and Happy Days ($42.6 million), are both in Farmingdale, Long Island — and together they sell more than the entire Bronx, Staten Island or North Country. The top 10 stores take 15% of statewide sales; the top 25 take 24%.
The real growth engine is new doors. 113 stores opened in 2026 and have already sold $57.9 million between them. Among stores open all year, the biggest summer accelerators were upstate — Catskill Mountain High in the Mid-Hudson (+303%) and the Flynnstoned chain’s Oswego, Syracuse and Binghamton locations (each up 200% or more). The biggest decliners look like stores that got new competition nearby: Root 9 in the Mid-Hudson (−95%), Green Flower Wellness in Oakland Gardens, Queens (−54%), Indoor Treez on 8th Avenue (−53%). Even The Travel Agency’s Downtown Brooklyn flagship — still the third-largest store in the state at $15.7 million — ran 23% below its earlier pace over the summer.
Manhattan sells the most. Long Island sells the most per store. The Bronx barely registers.
New York’s 14 regions (I’ve split the city into its five boroughs) tell three different stories.
Manhattan is the biggest market: $213 million, 18% of the state, from 97 stores. It also has the highest spending per resident — $129 — and the densest retail, with a store for every 17,000 people. The median Manhattan store does $1.7 million.
Long Island is the outlier. It has just 19 stores — one for every 154,000 residents, by far the sparsest coverage in the state — and they sold $157 million, almost as much as Manhattan’s 97. The median Long Island store does $2.07 million, the highest anywhere, and the two largest stores in the state are both there. The reason is simple: most Long Island towns opted out of retail, so the few stores that exist draw from enormous catchments.
The Capital District is the quiet overachiever: 74 stores, $123 million, and $110 per resident, second only to Manhattan.
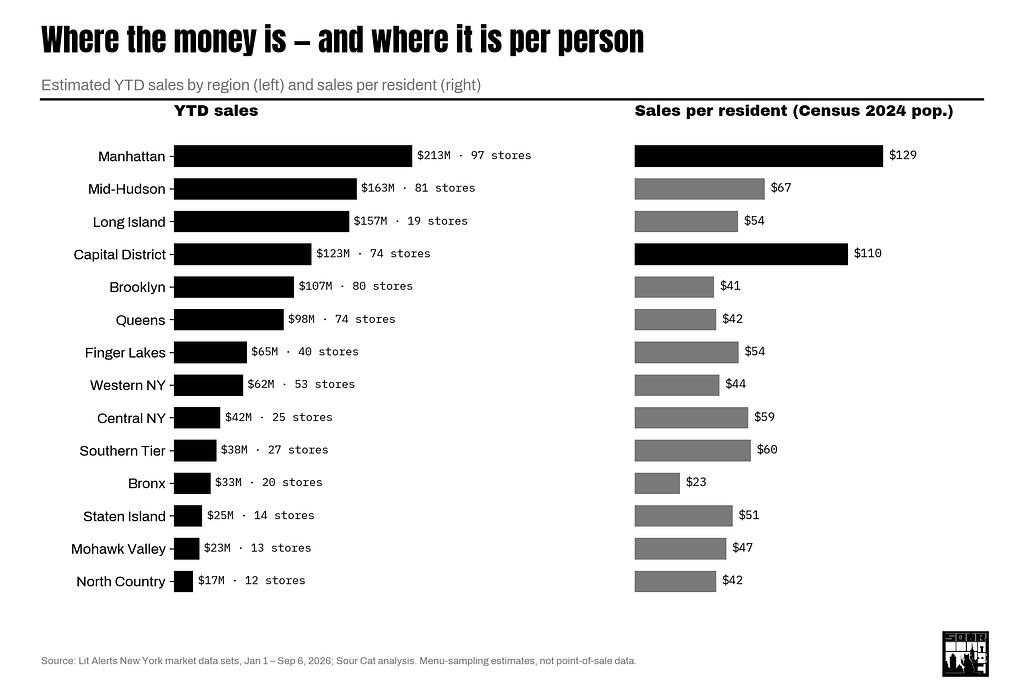
After that: Mid-Hudson ($163 million), Brooklyn ($107 million), Queens ($98 million), Finger Lakes ($65 million), Western New York ($62 million), Central New York ($42 million), Southern Tier ($38 million), the Bronx ($33 million), Staten Island ($25 million), Mohawk Valley ($23 million), North Country ($17 million).
Per resident, the spread is more than five to one. Manhattan $129, Capital District $110, then a broad middle from $67 (Mid-Hudson) down to $41 (Brooklyn) — and then the Bronx at $23, the lowest in the state despite 20 stores. Legal retail is not reaching every community equally. Brooklyn and the Bronx have both the lowest per-resident spending and the smallest median stores (Brooklyn’s is $894,000).
300 more stores are already licensed
If you take one number away from this piece, make it this one. Cross-referencing the state’s license list against open stores, 299 retail locations hold an active license but haven’t opened yet, and about 240 more are in process. That’s a pipeline of roughly 540 stores against about 630 selling today.
If even half of them open in the next year, the state adds 150 stores to a market growing 15 to 20%. The arithmetic is unforgiving: sales up 20% spread across 25% more stores means the average store sells less even as the state sells more. The summer decliners above are the leading edge. It’ll hit hardest where stores are already dense — Manhattan, Brooklyn, Queens, the Capital District — and barely touch the places where towns opted out.
So what does it all mean?
If you’re a consumer: 2026 is the year the legal market got competitive. Prices are down about 8% since January, the cheapest formats are growing fastest, and there’s a licensed store within reach of most of the state.
If you run a store: the easy years are over. The median store does $1.2 million year to date, the pipeline is nearly as big as the current footprint, and the stores holding their numbers either have geographic protection or a real reason to visit. Pre-rolls and drinks are where category growth is; edibles aren’t.
If you’re a brand: New York is wide open. Nobody has 5%, independents take 83% of sales, and the fastest growers this year were labels ramping from a small base. Price position matters more than pedigree — nearly half the money is in the $30–45 band.
If you’re an investor: the top line — $150 million, $869 million, $1.5 billion, and on pace for $1.7–1.8 billion — is real and still compounding, even as growth settles into the teens. But this is a market of hundreds of small businesses, not a few big ones, and the returns will go to whoever figures out the unit economics of a $1–2 million store in a state that opens a new one every few days.
About the numbers: Sales, unit and price figures come from Lit Alerts’ New York market data sets (OverallDailySummary, OverallCategoriesAnalytics, OverallBrandsAnalytics and OverallDispensariesAnalytics exports for January 1 through September 6, 2026), covering 630 stores, 1,150 brands and 12 categories. Lit Alerts derives its sales estimates from daily sampling of public dispensary menus; it is not point-of-sale data, and individual store and brand figures should be read as estimates. Statewide totals reconcile across the daily, category and store data sets within 0.5%. About 7% of sales carry no brand label, so brand shares are shares of branded sales. Category shifts compare January 1–July 31 with August 1–September 6. Brand and store “momentum” compares sales per day from May 5 to August 2 against the rest of the year; store momentum is only computed for stores open before 2026. Regions follow the Office of Cannabis Management’s definitions with New York City split into boroughs; stores were matched to OCM’s public license list; population is the U.S. Census Bureau’s Vintage 2024 estimates. Annual figures for 2023–2025 are from OCM releases and reporting linked above. Full-year projections are simple extrapolations, not forecasts.
This article was written with the help of Claude.
Originally published on Medium.