Research /Research
The Overlooked Category in New York’s Cannabis Boom
The market grew double digits this summer, and late-summer data shows prices finally starting to slip. Concentrates are only 3% of it, and that number has room to move.
New York’s adult-use cannabis market had a strong summer. Retail sell-through ran between $5.1 and $5.3 million a day from August through the first week of September, a pace of roughly $155–160 million a month. That’s up 13–15% from the January–July average, with unit volume up 17–21%. And the newest data adds a wrinkle worth watching: after holding steady all year, prices across every major category slipped 2–4% below their year-to-date averages in late summer. Volume growth is more than covering it, but the price era of this market may be ending.
Most of the coverage of this market focuses on the categories that already dominate it. I think the more interesting question is which category grows from here.
Pre-rolls set the pace
The clear winner so far in 2026 is pre-rolls, and the latest data shows no letup. Volume hit about 52,000 units a day in the first week of September, 32% above the January–July average, at $22.14 an item — a couple percent below the year-to-date price, which is drift, not discounting. Pre-rolls went from 31% of all units sold to 33.5% and have gained share in every period this year. More than one in three products sold in New York is now a pre-roll.
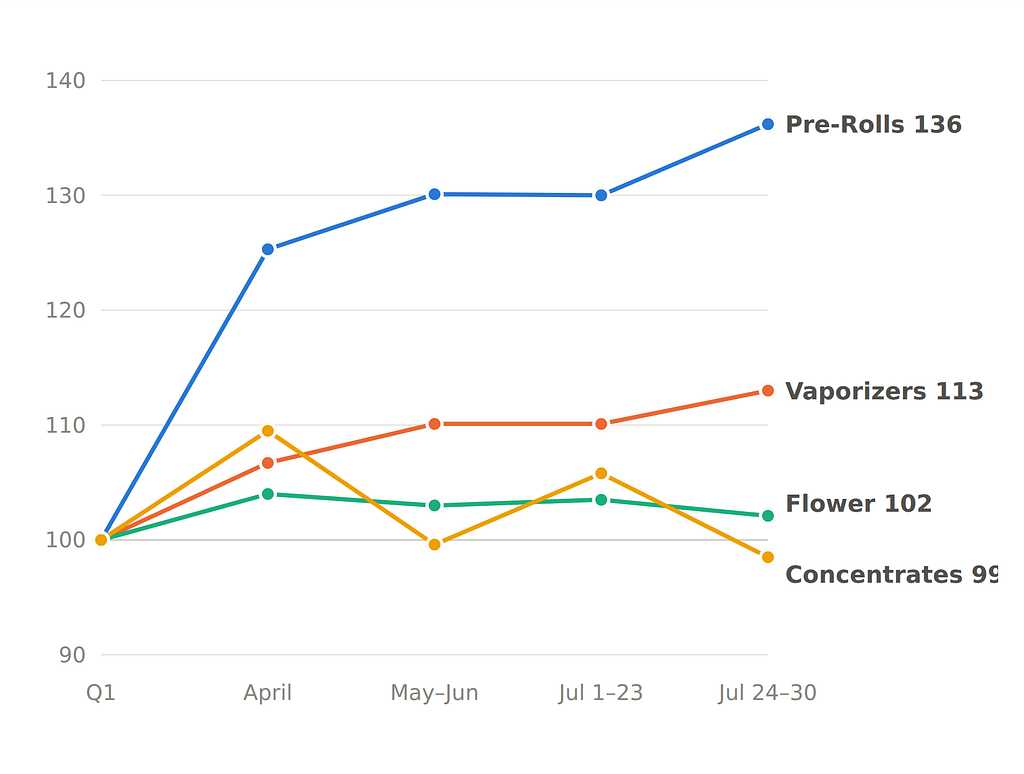
The rest of the market looks healthy too. Flower is still the biggest category by revenue, about a third of all dollars, and grew 14% as more of it gets sold in pre-rolled form. Vapes grew 15–17% in units and remain the second-biggest dollar category at 28% of sales — but they’re also where the new price softness shows most: the average vape sold for $52.33 across the year and $50.51 in the first week of September, a 3.5% slide. That’s the first real price movement in what had been the most stable category in the market. Edibles were flat to slightly down in units, and beverages jumped 76% over the summer months.
Concentrates are the outlier
Dabbable concentrates — rosin, resin, badder — are about 3% of New York’s cannabis dollars. In Oregon they’re 9%. Washington, 7.9%. Colorado, 7.5%. Michigan, 6%. Of the 14 state markets with comparable public data, New York is at the bottom.
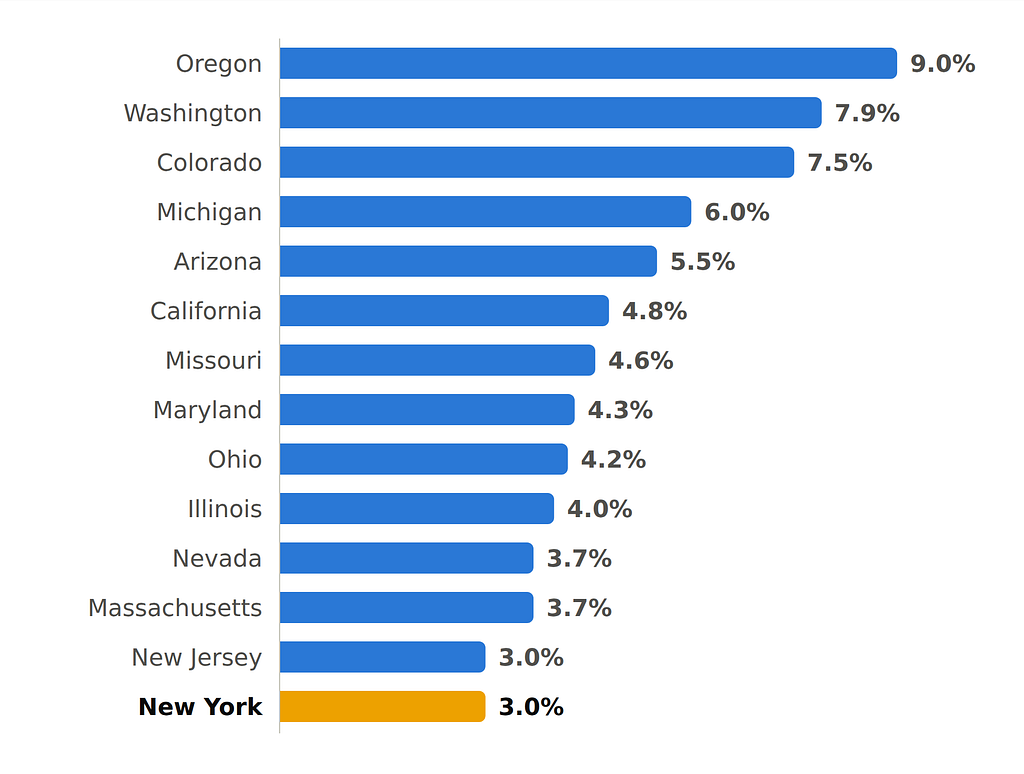
You could read that as a failing category. I read it as the category with the most room left in the state, because it’s already moving: New York concentrates grew about 33% year over year as of May, the fastest of any category, and just posted their best week of 2026 — nearly 3,000 units a day in the first week of September, 10% above the first-half run rate. Their share of dollars has held at 3.0% for over a month now, after drifting down all spring. And here’s the part that matters most for the thesis: the average concentrate ticket, stuck near $54.50 all year, fell to $52.51 in the latest week. That’s a 3.6% decline — small, but it’s the first sustained price movement the category has shown, and it’s in the direction that history says unlocks growth.
What the other states show
Looking across all 14 markets, the thing that predicts concentrate penetration isn’t how old the market is. It’s the price of a gram.
The states where concentrates are big are the states where they’re cheap: $8.43 a gram in Washington, $11.59 in Michigan, $11.88 in Oregon. The young states that got there quickly did it the same way. Missouri opened two months after New York and is already at 4.6% of sales. Maryland is at 4.3% in under three years. Ohio hit 4.2% in under two. All three sell concentrates for $29–34 a gram.
New York sells them for $46.52, the most expensive in the country.
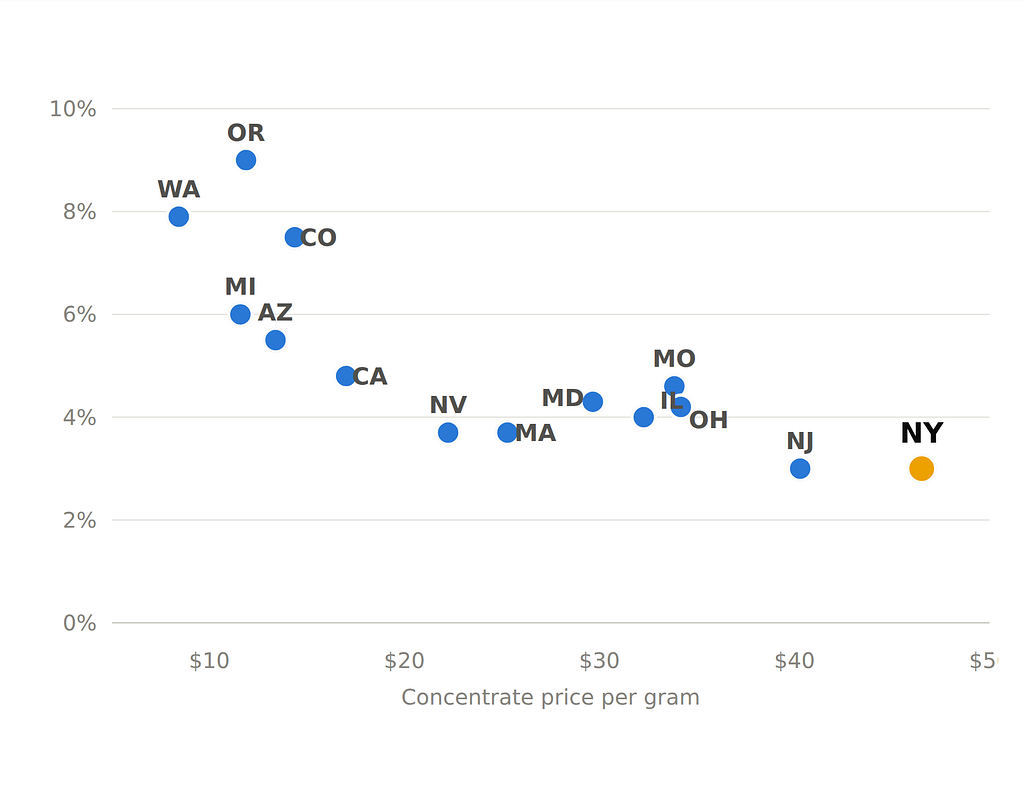
The pattern in the data is fairly consistent: when grams are priced in the $30s or below, concentrates reach about 4% of sales within two to three years. When they’re priced higher, growth stalls. New York’s prices are high because its supply chain is still young, and prices in every legal state have come down as cultivation and processing scaled. There’s little reason to expect New York to be the exception.
The caveats
Two things keep me from getting carried away. Concentrates are growing slower than the overall market — up 6–10% in late summer against a market up 13–15% — so they’re treading water on share, holding at 3.0% rather than gaining. The growth story still depends on prices falling further; a 3.6% dip is a start, not the unlock. And concentrates are shrinking year over year in several mature markets, so New York’s realistic destination is probably the 3.5–5% range its peer states occupy, not Oregon’s 9%.
Even so, the math is worth writing down. New York is pacing toward a roughly $1.9 billion annual market, and growing. Each point of concentrate share is worth about $19 million a year at today’s size. Going from 3% to 4.5% would be around $29 million in new category sales annually, before accounting for the market’s own growth.
The number I’m watching is $35 a gram. If New York concentrates get under it, fourteen other states suggest the share follows. The operators and brands that build their concentrate shelf before that happens will be the ones positioned for it — the same way the pre-roll brands that showed up early are the ones winning 2026.
Methodology: Sales figures are derived from retail sell-through estimates for the New York adult-use market (full-market scope, January 1–September 8, 2026, including Aug 10–Sep 8 and Sep 2–8 windows), with comparisons computed on a per-day run-rate basis. State benchmark shares, per-gram prices, and year-over-year figures are from Headset’s public market pages (May 2026) for OR, WA, CO, MI, AZ, CA, MO, MD, OH, IL, NV, MA, NJ, and NY. Figures are market estimates, not audited state totals. This article was written using Claude.
Originally published on Medium.