Westchester Has the Most Dispensaries in the Mid-Hudson. Ulster Spends the Most Per Person.
Westchester has more dispensaries than any other county in the Mid-Hudson (26) and the most sales ($65.4M).
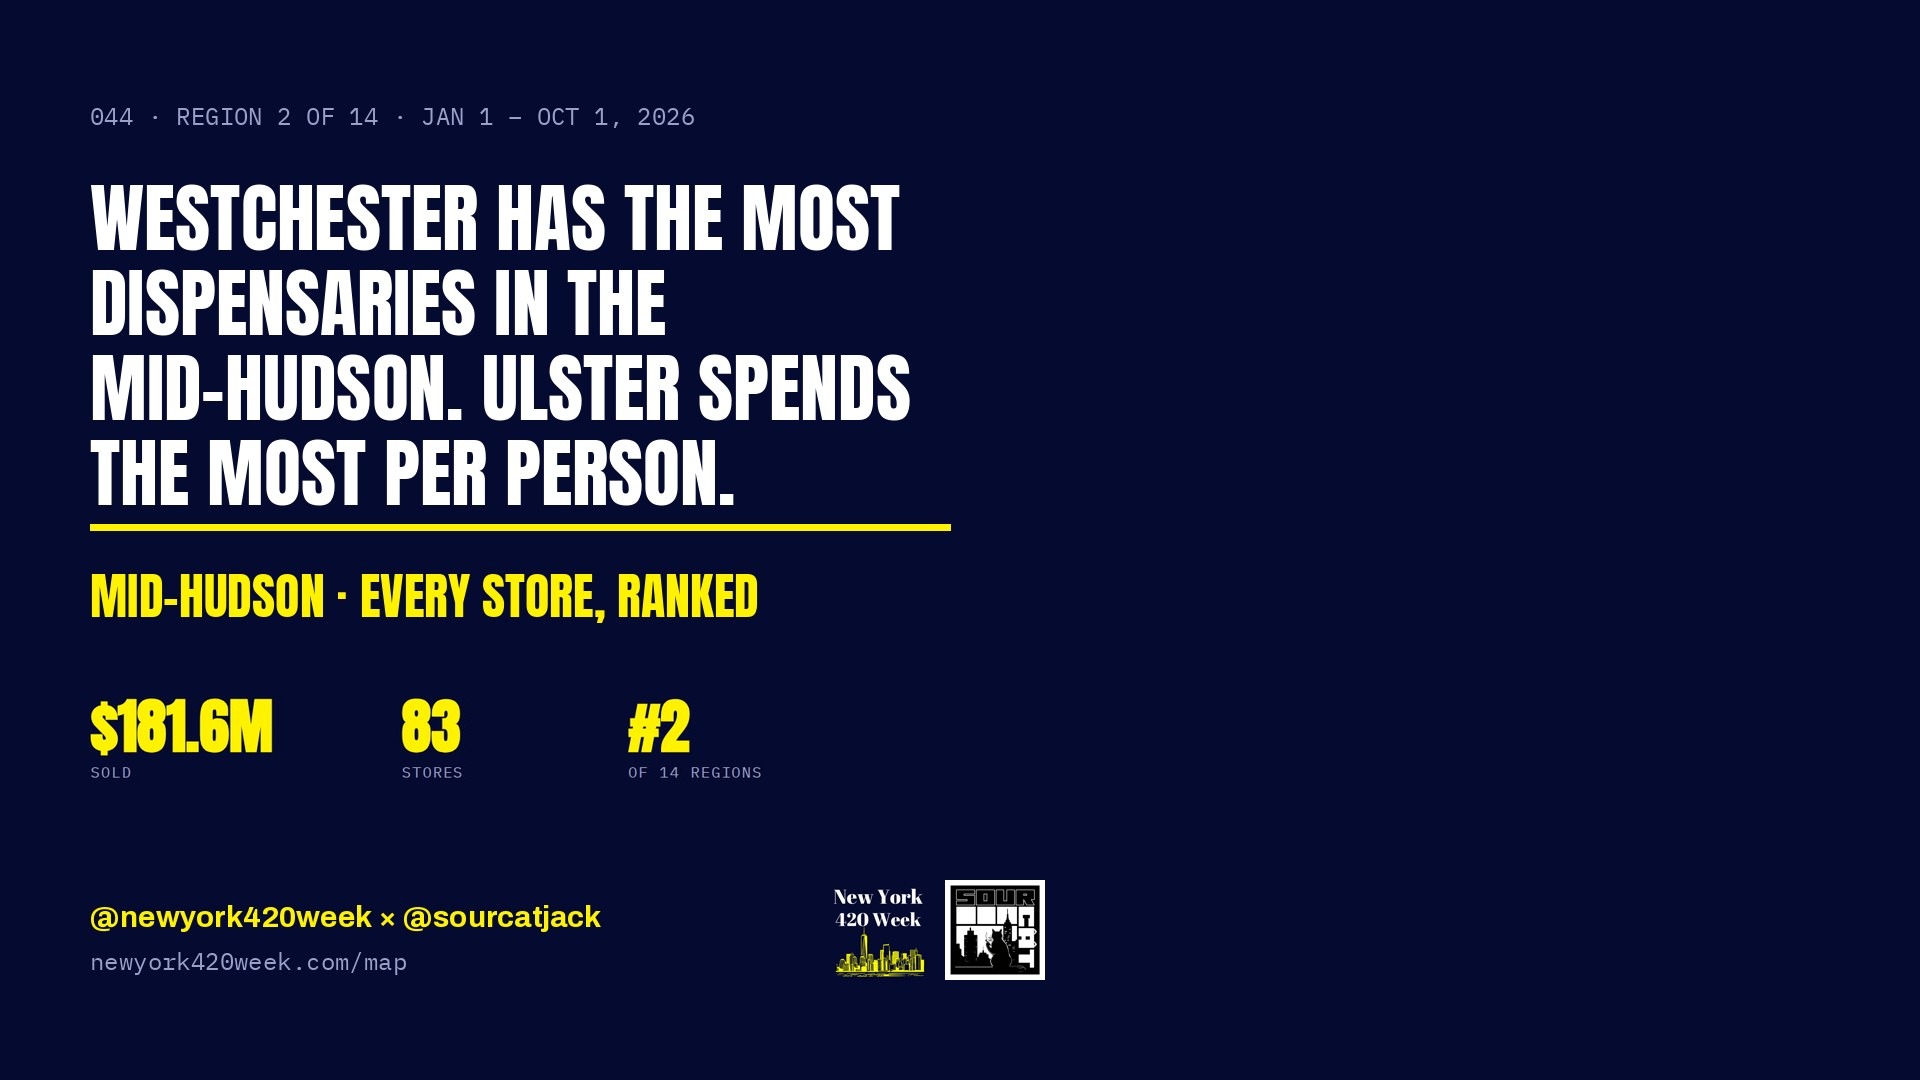
Westchester has more dispensaries than any other county in the Mid-Hudson (26) and the most sales ($65.4M). Per resident, though, Ulster County leads the region at $122 a person. Westchester comes in at $65.
Overall, the Mid-Hudson's 83 dispensaries sold an estimated $181.6M, 14.0% of New York's total and No. 2 of the state's 14 regions. The average store sold $2.19M and the median store $1.65M. That works out to $78 per resident and one store for every 28,069 people. Another 36 licensed stores in the region haven't opened yet.
About the numbers: Sales figures are estimates from the Lit Alerts New York market data set for January 1 – October 1, 2026 (October 1 is a partial day). Store locations and counties come from the Office of Cannabis Management's Current OCM Licenses dataset. Population is from the U.S. Census Bureau's Vintage 2024 county estimates. Every store is on the New York 420 Week dispensary map.
Every Mid-Hudson store in the top 20
| Rank | Store | Town | County | Est. sales | State rank |
|---|---|---|---|---|---|
| 1 | Curaleaf - Newburgh | Newburgh | Orange | $10.6M | #9 |
| 2 | Cannabis Realm - White Plains | White Plains | Westchester | $10.4M | #10 |
| 3 | Treehouse - Nyack | Nyack | Rockland | $7.4M | #16 |
| 4 | Farmers Choice Dispensary - Fishkill | Fishkill | Dutchess | $7.0M | #18 |
| 5 | Leafology | White Plains | Westchester | $6.1M | #27 |
| 6 | Purple Plains | Pound Ridge | Westchester | $5.5M | #37 |
| 7 | Kings House of Fire | Cortlandt | Westchester | $5.4M | #40 |
| 8 | County Road Cannabis | New Hampton | Orange | $5.0M | #46 |
| 9 | Canna Planet - Kingston | Kingston | Ulster | $4.8M | #47 |
| 10 | Domes Dispensary | Kingston | Ulster | $4.3M | #56 |
| 11 | Canna Planet - Middletown | Middletown | Orange | $4.3M | #57 |
| 12 | Black Market Canna - Poughkeepsie | Poughkeepsie | Dutchess | $4.0M | #67 |
| 13 | Canna Planet - Monticello | Monticello | Sullivan | $3.7M | #74 |
| 14 | Starlife Dispensary | White Plains | Westchester | $3.7M | #75 |
| 15 | Elevate NY | Mt Vernon | Westchester | $3.6M | #82 |
| 16 | Nuna Harvest | Mt Vernon | Westchester | $3.6M | #83 |
| 17 | Orange County Cannabis - Middletown | Middletown | Orange | $3.4M | #93 |
| 18 | Strain Stars - White Plains | White Plains | Westchester | $3.4M | #96 |
| 19 | Mindset Cannabis Shop | Tarrytown | Westchester | $3.4M | #99 |
| 20 | Grounded | Poughkeepsie | Dutchess | $3.3M | #104 |
The other 63 stores, with their rank in the region, county and state, are on the dispensary map.
By county
| County | Stores | Est. sales | Avg store | Per resident |
|---|---|---|---|---|
| Westchester | 26 | $65.4M | $2.52M | $65 |
| Orange | 17 | $38.2M | $2.25M | $93 |
| Dutchess | 15 | $29.3M | $1.95M | $98 |
| Ulster | 13 | $22.3M | $1.71M | $122 |
| Rockland | 7 | $18.0M | $2.57M | $52 |
| Sullivan | 5 | $8.4M | $1.68M | $105 |
How the stores stack up
7 stores sold more than $5 million, 26 sold between $2 million and $5 million, 25 sold between $1 million and $2 million, and 25 sold less than $1 million. The smallest store sold $4K.
Who runs the stores
Chains, meaning operators with two or more selling stores in New York, took 35.6% of the Mid-Hudson's sales, against 37% statewide. The top independent store is Treehouse - Nyack ($7.4M).
| Operator | Type | Stores here | Est. sales |
|---|---|---|---|
| Canna Planet | Chain | 7 | $18.9M |
| Cannabis Realm | Chain | 2 | $13.2M |
| Curaleaf | Chain | 1 | $10.6M |
| Farmers Choice Dispensary | Chain | 2 | $8.4M |
| Treehouse | Independent | 1 | $7.4M |
| Leafology | Independent | 1 | $6.1M |
Where the Mid-Hudson ranks among New York's 14 regions
No. 2 in total sales, No. 3 for average store, No. 4 for median store, No. 3 for sales per resident, No. 6 for stores per person, and No. 9 for chain share.
How we did it
Sales are Lit Alerts estimates built by sampling public dispensary menus, not point-of-sale data, so read any one store's figure as an estimate. Each store was matched to its OCM licence by name and address to get its location, county and region. Per-resident figures divide sales by the resident population of the region's counties.
This is part of a series. For the statewide picture, see our companion piece, Where New York's $1.29 Billion Goes: Every Dispensary Ranked by Region. Find every Mid-Hudson store, and its rank, on the dispensary map.